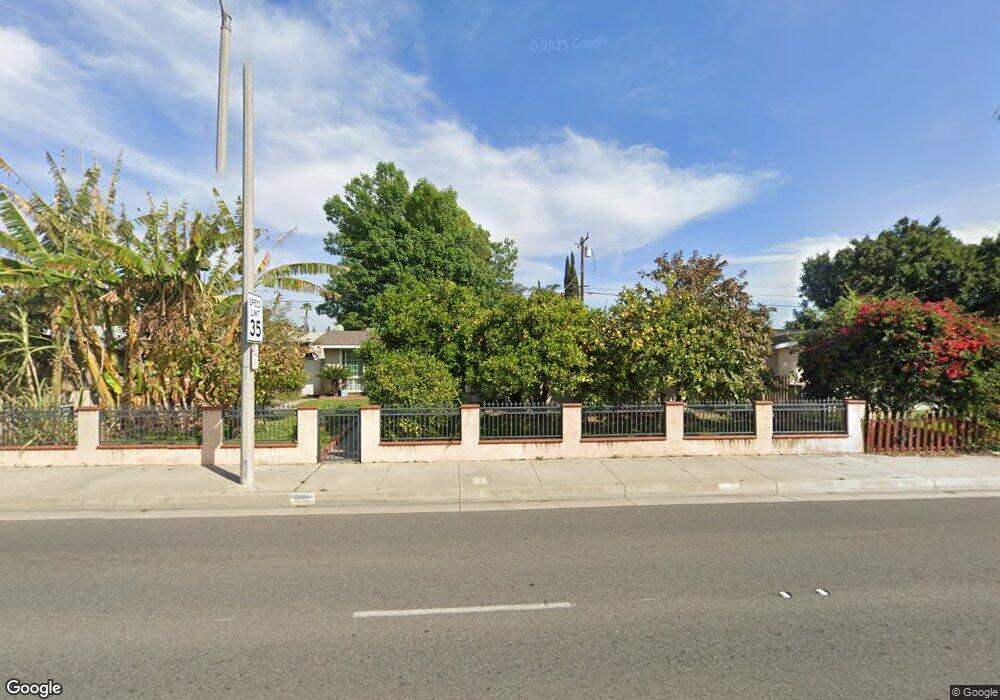
602 S State College Blvd Anaheim, CA 92806
Southeast Anaheim NeighborhoodEstimated Value: $839,000 - $920,000
3
Beds
2
Baths
1,288
Sq Ft
$672/Sq Ft
Est. Value
About This Home
This home is located at 602 S State College Blvd, Anaheim, CA 92806 and is currently estimated at $865,635, approximately $672 per square foot. 602 S State College Blvd is a home located in Orange County with nearby schools including Benito Juarez Elementary School, South Junior High School, and Katella High School.
Ownership History
Date
Name
Owned For
Owner Type
Purchase Details
Closed on
Dec 12, 2007
Sold by
Quinonez Jorge L and Loza Candelaria
Bought by
Quinonez Jorge L and Loza Candelaria
Current Estimated Value
Home Financials for this Owner
Home Financials are based on the most recent Mortgage that was taken out on this home.
Original Mortgage
$372,000
Outstanding Balance
$233,260
Interest Rate
6.12%
Mortgage Type
New Conventional
Estimated Equity
$632,375
Purchase Details
Closed on
Dec 8, 1999
Sold by
Ebbitt Shirley M
Bought by
Quinonez Jorge and Quinonez Candelaria
Home Financials for this Owner
Home Financials are based on the most recent Mortgage that was taken out on this home.
Original Mortgage
$172,621
Interest Rate
7.84%
Mortgage Type
FHA
Purchase Details
Closed on
Jul 30, 1999
Sold by
Ebbitt Gregory G
Bought by
Ebbitt Shirley M
Create a Home Valuation Report for This Property
The Home Valuation Report is an in-depth analysis detailing your home's value as well as a comparison with similar homes in the area
Home Values in the Area
Average Home Value in this Area
Purchase History
| Date | Buyer | Sale Price | Title Company |
|---|---|---|---|
| Quinonez Jorge L | -- | Advantage Title Inc | |
| Quinonez Jorge | $175,000 | Fidelity National Title Ins | |
| Ebbitt Shirley M | -- | -- |
Source: Public Records
Mortgage History
| Date | Status | Borrower | Loan Amount |
|---|---|---|---|
| Open | Quinonez Jorge L | $372,000 | |
| Previous Owner | Quinonez Jorge | $172,621 |
Source: Public Records
Tax History Compared to Growth
Tax History
| Year | Tax Paid | Tax Assessment Tax Assessment Total Assessment is a certain percentage of the fair market value that is determined by local assessors to be the total taxable value of land and additions on the property. | Land | Improvement |
|---|---|---|---|---|
| 2025 | $3,287 | $268,807 | $197,512 | $71,295 |
| 2024 | $3,287 | $263,537 | $193,639 | $69,898 |
| 2023 | $3,216 | $258,370 | $189,842 | $68,528 |
| 2022 | $3,173 | $253,304 | $186,119 | $67,185 |
| 2021 | $3,176 | $248,338 | $182,470 | $65,868 |
| 2020 | $3,162 | $245,792 | $180,599 | $65,193 |
| 2019 | $3,072 | $240,973 | $177,058 | $63,915 |
| 2018 | $3,010 | $236,249 | $173,587 | $62,662 |
| 2017 | $2,896 | $231,617 | $170,183 | $61,434 |
| 2016 | $2,886 | $227,076 | $166,846 | $60,230 |
| 2015 | $2,860 | $223,666 | $164,340 | $59,326 |
| 2014 | $2,689 | $219,285 | $161,121 | $58,164 |
Source: Public Records
Map
Nearby Homes
- 516 S State College Blvd
- 700 S Plymouth Place
- 554 S Elder St
- 1730 E Park St
- 1750 E Park St
- 2227 E Westport Dr
- 1615 E South St
- 1700 E Park St
- 1415 E South St
- Plan 1394 at Sunflower
- Plan 1810 Modeled at Sunflower
- Plan 1771 at Sunflower
- Plan 1827 at Sunflower
- Plan 1378 Modeled at Sunflower
- 2420 E Agave St Unit 6
- 2443 E Westport Cir
- 1720 E Park St
- 1720 E Park St Unit 12
- 2420 E Lincoln Ave Unit 2
- 2420 E Lincoln Ave Unit 3
- 562 S State College Blvd
- 608 S State College Blvd
- 603 S Reseda St
- 556 S State College Blvd
- 563 S Reseda St
- 612 S State College Blvd
- 609 S Reseda St
- 557 S Reseda St
- 613 S Reseda St
- 618 S State College Blvd
- 585 S State College Blvd
- 551 S Reseda St
- 619 S Reseda St
- 560 S Revere St
- 622 S State College Blvd
- 554 S Revere St
- 2104 E Alden Ave
- 547 S Reseda St
- 2105 E Alden Ave
- 623 S Reseda St