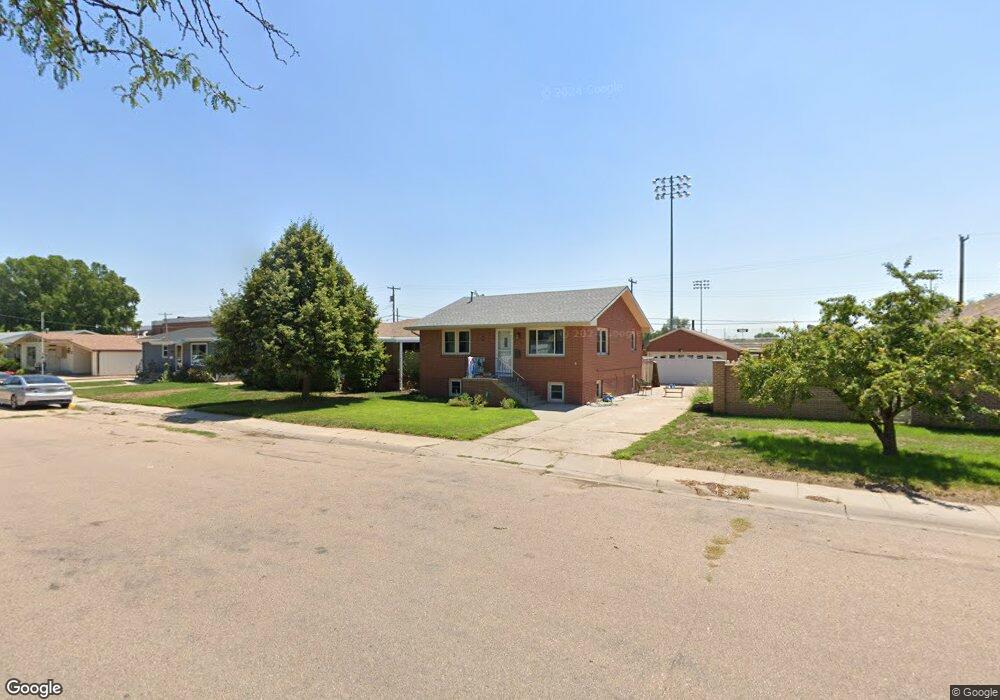
602 Student Dr Ogallala, NE 69153
Estimated Value: $175,000 - $200,000
3
Beds
2
Baths
868
Sq Ft
$216/Sq Ft
Est. Value
About This Home
This home is located at 602 Student Dr, Ogallala, NE 69153 and is currently estimated at $187,892, approximately $216 per square foot. 602 Student Dr is a home with nearby schools including Ogallala High School, St. Luke's Elementary School, and St. Paul's Lutheran School.
Ownership History
Date
Name
Owned For
Owner Type
Purchase Details
Closed on
Jun 10, 2024
Sold by
Tical Llc
Bought by
Wood Chris and Wood Kristin
Current Estimated Value
Home Financials for this Owner
Home Financials are based on the most recent Mortgage that was taken out on this home.
Original Mortgage
$148,200
Outstanding Balance
$146,105
Interest Rate
7.17%
Mortgage Type
New Conventional
Estimated Equity
$41,787
Purchase Details
Closed on
Nov 15, 2023
Sold by
Riggs Justin S and Riggs Danielle L
Bought by
Tical Llc
Purchase Details
Closed on
Dec 29, 2017
Sold by
Humphrey Charles and Humphrey Rochelle
Bought by
Riggs Justin S and Riggs Danielle L
Purchase Details
Closed on
Aug 12, 2010
Sold by
Nielson Lyle D and Nielson Patricia F
Bought by
Gilmore Tim and Gilmore Kit
Purchase Details
Closed on
Jul 19, 2007
Sold by
Hutchinson Michael D and Hutchinson Karyl L
Bought by
Nielson Lyle D and Nielson Patricia F
Create a Home Valuation Report for This Property
The Home Valuation Report is an in-depth analysis detailing your home's value as well as a comparison with similar homes in the area
Home Values in the Area
Average Home Value in this Area
Purchase History
| Date | Buyer | Sale Price | Title Company |
|---|---|---|---|
| Wood Chris | $156,000 | Thalken Title | |
| Tical Llc | $100,000 | Thalken Title | |
| Riggs Justin S | $105,000 | Thalken Title Co | |
| Gilmore Tim | $85,000 | None Available | |
| Nielson Lyle D | $87,000 | None Available |
Source: Public Records
Mortgage History
| Date | Status | Borrower | Loan Amount |
|---|---|---|---|
| Open | Wood Chris | $148,200 | |
| Closed | Gilmore Tim | $0 |
Source: Public Records
Tax History
| Year | Tax Paid | Tax Assessment Tax Assessment Total Assessment is a certain percentage of the fair market value that is determined by local assessors to be the total taxable value of land and additions on the property. | Land | Improvement |
|---|---|---|---|---|
| 2025 | $1,622 | $152,245 | $12,245 | $140,000 |
| 2024 | $1,695 | $158,240 | $12,245 | $145,995 |
| 2023 | $1,941 | $139,105 | $10,205 | $128,900 |
| 2022 | $1,783 | $112,535 | $8,315 | $104,220 |
| 2021 | $1,676 | $102,405 | $8,315 | $94,090 |
| 2020 | $1,764 | $106,835 | $8,315 | $98,520 |
| 2019 | $1,666 | $96,540 | $7,560 | $88,980 |
| 2018 | $1,593 | $90,515 | $7,560 | $82,955 |
| 2017 | $1,551 | $87,595 | $7,560 | $80,035 |
| 2016 | $1,594 | $87,595 | $7,560 | $80,035 |
| 2015 | $1,243 | $63,305 | $6,300 | $57,005 |
| 2010 | -- | $63,305 | $6,300 | $57,005 |
Source: Public Records
Map
Nearby Homes
Your Personal Tour Guide
Ask me questions while you tour the home.