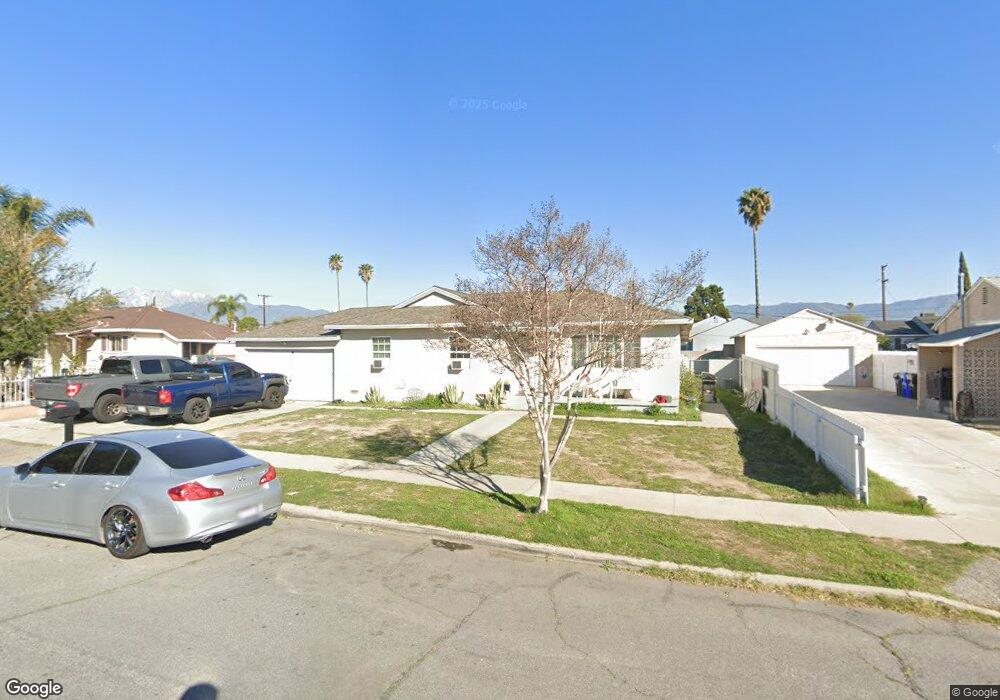
602 W Cornell Dr Rialto, CA 92376
Estimated Value: $483,000 - $525,000
3
Beds
2
Baths
1,330
Sq Ft
$379/Sq Ft
Est. Value
About This Home
This home is located at 602 W Cornell Dr, Rialto, CA 92376 and is currently estimated at $503,555, approximately $378 per square foot. 602 W Cornell Dr is a home located in San Bernardino County with nearby schools including Dunn Elementary School, Ethel Kucera Middle School, and Eisenhower High School.
Ownership History
Date
Name
Owned For
Owner Type
Purchase Details
Closed on
Nov 9, 2019
Sold by
Wang Julian and Chen Chia Chi
Bought by
Joint Inspire Llc
Current Estimated Value
Purchase Details
Closed on
Oct 4, 2011
Sold by
Chen Chia Chi
Bought by
Wang Julian and Chen Chia Chi
Purchase Details
Closed on
Jun 24, 2010
Sold by
Federal National Mortgage Association
Bought by
Chen Chia Chi
Purchase Details
Closed on
Nov 10, 2009
Sold by
Salazar Saul and Salazar Maria A
Bought by
Federal National Mortgage Association
Purchase Details
Closed on
Jul 13, 2004
Sold by
Minchin Irving L and Minchin Anna E
Bought by
Salazar Saul and Salazar Maria A
Home Financials for this Owner
Home Financials are based on the most recent Mortgage that was taken out on this home.
Original Mortgage
$176,000
Interest Rate
6.6%
Mortgage Type
Purchase Money Mortgage
Create a Home Valuation Report for This Property
The Home Valuation Report is an in-depth analysis detailing your home's value as well as a comparison with similar homes in the area
Home Values in the Area
Average Home Value in this Area
Purchase History
| Date | Buyer | Sale Price | Title Company |
|---|---|---|---|
| Joint Inspire Llc | -- | None Available | |
| Wang Julian | -- | Accommodation | |
| Chen Chia Chi | $120,000 | Lawyers Title Company | |
| Federal National Mortgage Association | $265,405 | Accommodation | |
| Salazar Saul | $220,000 | United Title |
Source: Public Records
Mortgage History
| Date | Status | Borrower | Loan Amount |
|---|---|---|---|
| Previous Owner | Salazar Saul | $176,000 | |
| Closed | Salazar Saul | $44,000 |
Source: Public Records
Tax History Compared to Growth
Tax History
| Year | Tax Paid | Tax Assessment Tax Assessment Total Assessment is a certain percentage of the fair market value that is determined by local assessors to be the total taxable value of land and additions on the property. | Land | Improvement |
|---|---|---|---|---|
| 2025 | $2,267 | $153,741 | $44,842 | $108,899 |
| 2024 | $2,267 | $150,727 | $43,963 | $106,764 |
| 2023 | $2,391 | $147,772 | $43,101 | $104,671 |
| 2022 | $2,212 | $144,875 | $42,256 | $102,619 |
| 2021 | $2,201 | $142,034 | $41,427 | $100,607 |
| 2020 | $2,203 | $140,577 | $41,002 | $99,575 |
| 2019 | $2,160 | $137,821 | $40,198 | $97,623 |
| 2018 | $2,087 | $135,119 | $39,410 | $95,709 |
| 2017 | $2,074 | $132,469 | $38,637 | $93,832 |
| 2016 | $1,716 | $129,871 | $37,879 | $91,992 |
| 2015 | $1,723 | $127,920 | $37,310 | $90,610 |
| 2014 | $1,723 | $125,414 | $36,579 | $88,835 |
Source: Public Records
Map
Nearby Homes
- 955 W Jasmine Way
- 590 N Lilac Ave
- 531 W Ramona Dr
- 459 W Ramona Dr
- 847 N Idyllwild Ave
- 836 N Millard Ave
- 786 N Arrowhead Ave
- 249 W Morgan St
- 885 N Millard Ave
- 350 N Clifford Ave
- 435 N Beechwood Ave
- 342 N Clifford Ave
- 938 W Jasmine Way
- 572 N Teakwood Ave
- 1031 N Lilac Ave
- 975 W Clover Ave
- 1018 N Millard Ave
- 215 W Valencia St
- 425 N Beechwood Ave
- 211 N Fillmore Ave
- 610 W Cornell Dr
- 590 W Cornell Dr
- 612 W Cornell Dr
- 588 W Cornell Dr
- 603 W Cornell Dr
- 593 W Cornell Dr
- 582 W Cornell Dr
- 618 W Cornell Dr
- 613 W Cornell Dr
- 583 W Cornell Dr
- 630 W Cornell Dr
- 570 W Cornell Dr
- 623 W Cornell Dr
- 573 W Cornell Dr
- 603 W Victoria St
- 603 W Victoria St
- 578 W Cornell Dr
- 613 W Victoria St
- 622 W Cornell Dr
- 593 W Victoria St