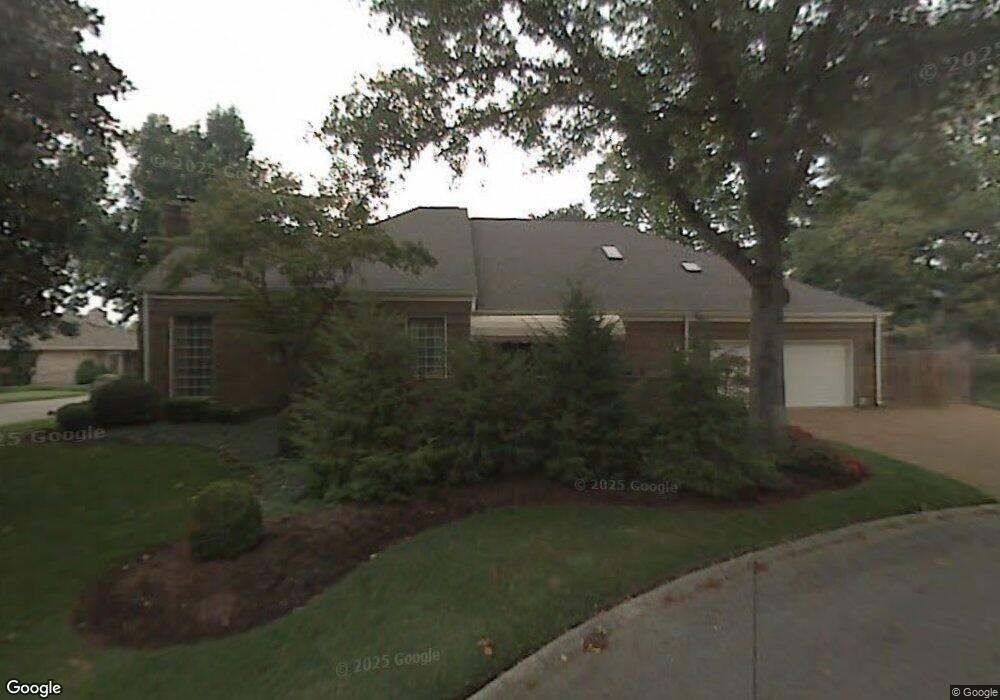
6020 Wellesley Way Brentwood, TN 37027
Estimated Value: $947,518 - $1,531,000
--
Bed
3
Baths
3,372
Sq Ft
$369/Sq Ft
Est. Value
About This Home
This home is located at 6020 Wellesley Way, Brentwood, TN 37027 and is currently estimated at $1,242,630, approximately $368 per square foot. 6020 Wellesley Way is a home located in Williamson County with nearby schools including Scales Elementary School, Brentwood Middle School, and Brentwood High School.
Ownership History
Date
Name
Owned For
Owner Type
Purchase Details
Closed on
Feb 16, 1999
Sold by
Webb R Dan and Webb Kelly B
Bought by
Jones Marjory A
Current Estimated Value
Home Financials for this Owner
Home Financials are based on the most recent Mortgage that was taken out on this home.
Original Mortgage
$200,000
Outstanding Balance
$46,508
Interest Rate
6.79%
Estimated Equity
$1,196,122
Purchase Details
Closed on
Jan 16, 1998
Sold by
Lebahn Arthur C and Lebahn Lois J
Bought by
Webb R Dan and Webb Kelly B
Home Financials for this Owner
Home Financials are based on the most recent Mortgage that was taken out on this home.
Original Mortgage
$260,000
Interest Rate
7.19%
Purchase Details
Closed on
Sep 30, 1994
Sold by
Christie James R
Bought by
Lebahn Arthur C
Create a Home Valuation Report for This Property
The Home Valuation Report is an in-depth analysis detailing your home's value as well as a comparison with similar homes in the area
Home Values in the Area
Average Home Value in this Area
Purchase History
| Date | Buyer | Sale Price | Title Company |
|---|---|---|---|
| Jones Marjory A | $357,000 | Realty Title & Escrow Compan | |
| Webb R Dan | $357,000 | First Title Escrow Co Inc | |
| Lebahn Arthur C | $300,000 | -- |
Source: Public Records
Mortgage History
| Date | Status | Borrower | Loan Amount |
|---|---|---|---|
| Open | Jones Marjory A | $200,000 | |
| Previous Owner | Webb R Dan | $260,000 |
Source: Public Records
Tax History Compared to Growth
Tax History
| Year | Tax Paid | Tax Assessment Tax Assessment Total Assessment is a certain percentage of the fair market value that is determined by local assessors to be the total taxable value of land and additions on the property. | Land | Improvement |
|---|---|---|---|---|
| 2025 | $3,549 | $236,075 | $101,250 | $134,825 |
| 2024 | $3,549 | $163,550 | $46,250 | $117,300 |
| 2023 | $3,549 | $163,550 | $46,250 | $117,300 |
| 2022 | $3,549 | $163,550 | $46,250 | $117,300 |
| 2021 | $3,549 | $163,550 | $46,250 | $117,300 |
| 2020 | $3,877 | $150,275 | $37,500 | $112,775 |
| 2019 | $3,877 | $150,275 | $37,500 | $112,775 |
| 2018 | $3,772 | $150,275 | $37,500 | $112,775 |
| 2017 | $3,742 | $150,275 | $37,500 | $112,775 |
| 2016 | $3,697 | $150,275 | $37,500 | $112,775 |
| 2015 | -- | $108,450 | $33,750 | $74,700 |
| 2014 | $477 | $108,450 | $33,750 | $74,700 |
Source: Public Records
Map
Nearby Homes
- 1222 Old Hickory Blvd
- 6103 Bryan Place
- 1307 Old Hickory Blvd
- 922 Dorset Dr
- 309 Hayeswood Dr
- 321 Granny White Pike
- 1144 Oman Dr
- 1404 Old Hickory Blvd
- 1122 Oman Dr
- 1613 Windy Ridge Dr
- 6101 Belle Rive Dr
- 5218 Meadowlake Rd
- 6224 Waxwood Ct
- 1708 Woodsong Dr
- 528 Waxwood Dr
- 1701 Woodsong Dr
- 5205 Williamsburg Rd
- 57 Annandale
- 6301 Belle Rive Dr
- 5116 Williamsburg Rd
- 6018 Wellesley Way
- 6022 Wellesley Way
- 6031 Landmark Place
- 110 Atrium Ct
- 6019 Wellesley Way
- 6021 Wellesley Way
- 6027 Landmark Place
- 6017 Wellesley Way
- 6024 Wellesley Way
- 6015 Wellesley Way
- 6023 Landmark Place
- 6032 Landmark Place
- 109 Atrium Ct
- 6012 Wellesley Way
- 6030 Landmark Place
- 6023 Wellesley Way
- 6021 Landmark Place
- 6026 Wellesley Way
- 6013 Wellesley Way
- 111 Courtyard Dr