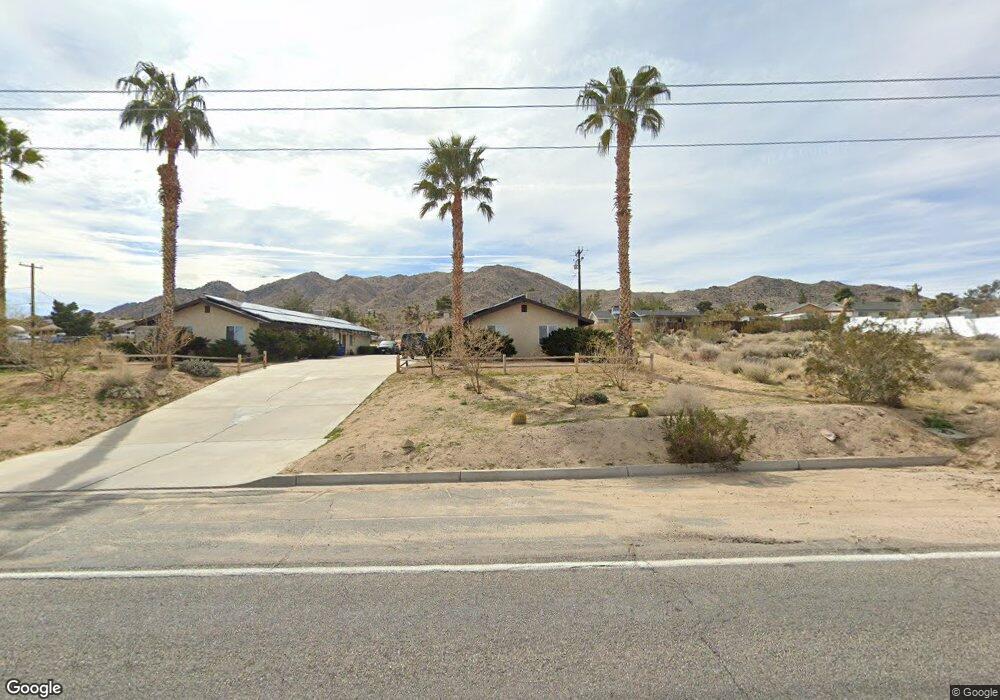
60215 Alta Loma Dr Joshua Tree, CA 92252
Estimated Value: $498,000 - $815,000
--
Bed
--
Bath
--
Sq Ft
0.44
Acres
About This Home
This home is located at 60215 Alta Loma Dr, Joshua Tree, CA 92252 and is currently estimated at $631,500. 60215 Alta Loma Dr is a home located in San Bernardino County with nearby schools including Friendly Hills Elementary School, La Contenta Middle School, and Yucca Valley High School.
Ownership History
Date
Name
Owned For
Owner Type
Purchase Details
Closed on
Apr 14, 2015
Sold by
Liveby The Parh Investments Llc
Bought by
Davis David W and Davis Judith A
Current Estimated Value
Home Financials for this Owner
Home Financials are based on the most recent Mortgage that was taken out on this home.
Original Mortgage
$274,966
Outstanding Balance
$211,597
Interest Rate
3.73%
Mortgage Type
New Conventional
Estimated Equity
$419,903
Purchase Details
Closed on
Jan 14, 2005
Sold by
Davis David W
Bought by
Livebythepark Investments Llc
Purchase Details
Closed on
Jan 28, 1994
Sold by
Wyss Shirley E
Bought by
Davis David W and Davis Judith Ann
Home Financials for this Owner
Home Financials are based on the most recent Mortgage that was taken out on this home.
Original Mortgage
$100,000
Interest Rate
6.12%
Create a Home Valuation Report for This Property
The Home Valuation Report is an in-depth analysis detailing your home's value as well as a comparison with similar homes in the area
Home Values in the Area
Average Home Value in this Area
Purchase History
| Date | Buyer | Sale Price | Title Company |
|---|---|---|---|
| Davis David W | -- | Premium Title Of Ca Inc | |
| Livebythepark Investments Llc | -- | -- | |
| Davis David W | $125,000 | First American Title Ins Co |
Source: Public Records
Mortgage History
| Date | Status | Borrower | Loan Amount |
|---|---|---|---|
| Open | Davis David W | $274,966 | |
| Previous Owner | Davis David W | $100,000 |
Source: Public Records
Tax History Compared to Growth
Tax History
| Year | Tax Paid | Tax Assessment Tax Assessment Total Assessment is a certain percentage of the fair market value that is determined by local assessors to be the total taxable value of land and additions on the property. | Land | Improvement |
|---|---|---|---|---|
| 2025 | $2,938 | $212,459 | $20,396 | $192,063 |
| 2024 | $2,938 | $208,293 | $19,996 | $188,297 |
| 2023 | $2,888 | $204,209 | $19,604 | $184,605 |
| 2022 | $2,836 | $200,205 | $19,220 | $180,985 |
| 2021 | $2,807 | $196,279 | $18,843 | $177,436 |
| 2020 | $2,787 | $194,267 | $18,650 | $175,617 |
| 2019 | $2,922 | $190,458 | $18,284 | $172,174 |
| 2018 | $2,737 | $186,723 | $17,925 | $168,798 |
| 2017 | $2,712 | $183,062 | $17,574 | $165,488 |
| 2016 | $2,671 | $179,472 | $17,229 | $162,243 |
| 2015 | $2,622 | $176,776 | $16,970 | $159,806 |
| 2014 | $2,644 | $173,314 | $16,638 | $156,676 |
Source: Public Records
Map
Nearby Homes
- 60255 Natoma Trail
- 60307 Alta Loma Dr
- 60219 Latham Trail
- 60205 Latham Trail
- 7374 Olympic Rd
- 7382 Olympic Rd
- 60194 La Mirada Trail
- 7201 Olympic Rd
- 0 Olympic Rd Unit JT25202576
- 7160 Olympic Rd
- 7112 Mecca Rd
- 60423 La Mirada Trail
- 60467 Natoma Trail
- 7320 Sherwood Rd
- 60377 Pueblo Trail
- 60150 Adobe Rd
- 7608 Olympic Rd
- 0 La Mirada Trail
- 60374 La Mirada Trail
- 60383 Melton Trail
- 60220 Natoma Trail
- 60206 Natoma Trail
- 60255 Alta Loma Dr
- 60256 Natoma Trail
- 60184 Natoma Trail
- 60226 Alta Loma Dr
- 60271 Alta Loma Dr
- 60271 Alta Loma Dr Unit One
- 60275 Alta Loma Dr
- 60219 Natoma Trail
- 60205 Alta Mesa Dr
- 60237 Natoma Trail
- 60225 Alta Mesa Dr
- 60165 Alta Mesa Dr
- 60291 Alta Loma Dr
- 60265 Natoma Trail
- 60292 Natoma Trail
- 60245 Alta Mesa Dr
- 60145 Alta Mesa Dr
- 7375 Olympic Rd