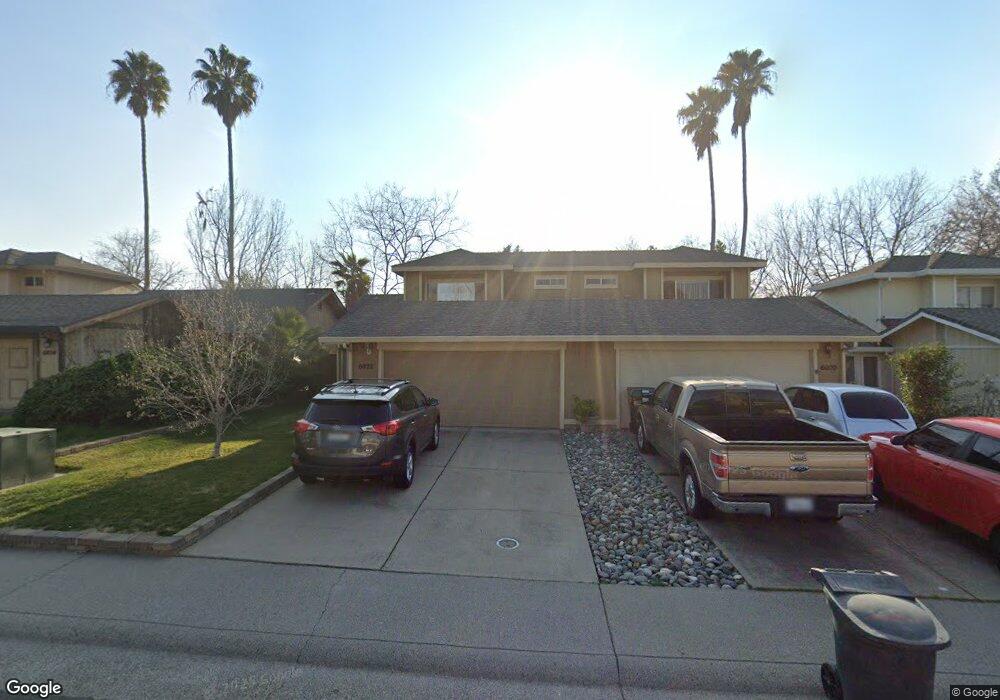
6022 Ogden Nash Way Sacramento, CA 95842
Hillsdale NeighborhoodEstimated Value: $319,000 - $382,000
3
Beds
2
Baths
1,104
Sq Ft
$320/Sq Ft
Est. Value
About This Home
This home is located at 6022 Ogden Nash Way, Sacramento, CA 95842 and is currently estimated at $353,072, approximately $319 per square foot. 6022 Ogden Nash Way is a home located in Sacramento County with nearby schools including Frontier Elementary School, Foothill Ranch Middle School, and Foothill High School.
Ownership History
Date
Name
Owned For
Owner Type
Purchase Details
Closed on
Aug 15, 2014
Sold by
Nichols Pamela J
Bought by
Nichols Pamela J and Nichols Living Trust
Current Estimated Value
Purchase Details
Closed on
Jan 16, 2003
Sold by
Nichols Pamela J and Stahl Pamela J
Bought by
Nichols Pamela J
Home Financials for this Owner
Home Financials are based on the most recent Mortgage that was taken out on this home.
Original Mortgage
$78,800
Interest Rate
5.97%
Purchase Details
Closed on
Oct 27, 1993
Sold by
Boyd Craig R
Bought by
Stahl Pamela J
Home Financials for this Owner
Home Financials are based on the most recent Mortgage that was taken out on this home.
Original Mortgage
$87,151
Interest Rate
6.95%
Mortgage Type
FHA
Create a Home Valuation Report for This Property
The Home Valuation Report is an in-depth analysis detailing your home's value as well as a comparison with similar homes in the area
Home Values in the Area
Average Home Value in this Area
Purchase History
| Date | Buyer | Sale Price | Title Company |
|---|---|---|---|
| Nichols Pamela J | -- | None Available | |
| Nichols Pamela J | -- | North American Title Co | |
| Stahl Pamela J | $87,500 | Sacramento Title Company |
Source: Public Records
Mortgage History
| Date | Status | Borrower | Loan Amount |
|---|---|---|---|
| Closed | Nichols Pamela J | $78,800 | |
| Closed | Stahl Pamela J | $87,151 | |
| Closed | Nichols Pamela J | $19,500 |
Source: Public Records
Tax History Compared to Growth
Tax History
| Year | Tax Paid | Tax Assessment Tax Assessment Total Assessment is a certain percentage of the fair market value that is determined by local assessors to be the total taxable value of land and additions on the property. | Land | Improvement |
|---|---|---|---|---|
| 2025 | $1,603 | $148,264 | $33,979 | $114,285 |
| 2024 | $1,603 | $145,358 | $33,313 | $112,045 |
| 2023 | $1,612 | $142,509 | $32,660 | $109,849 |
| 2022 | $1,517 | $139,716 | $32,020 | $107,696 |
| 2021 | $1,511 | $136,978 | $31,393 | $105,585 |
| 2020 | $1,497 | $135,575 | $31,072 | $104,503 |
| 2019 | $1,476 | $132,917 | $30,463 | $102,454 |
| 2018 | $1,401 | $130,312 | $29,866 | $100,446 |
| 2017 | $1,435 | $127,758 | $29,281 | $98,477 |
| 2016 | $1,435 | $125,254 | $28,707 | $96,547 |
| 2015 | $1,347 | $123,373 | $28,276 | $95,097 |
| 2014 | $1,372 | $120,958 | $27,723 | $93,235 |
Source: Public Records
Map
Nearby Homes
- 6047 Ogden Nash Way
- 6040 Ogden Nash Way
- 6216 Johanson Cir
- 6125 Jack London Cir
- 6324 Bonanza Dr
- 6309 Marshall Dr Unit 158
- 4737 Tacomic Dr
- 6317 Stagecoach Dr
- 6300 Stagecoach Dr
- 6315 Stagecoach Dr
- 6451 Villa Dr
- 6025 Brett Dr
- 6517 Filaree Way
- 5928 Brett Dr
- 6229 Stagecoach Dr
- 5924 Meghan Way
- 5972 Walerga Rd Unit 1
- 4421 Fenwick Way
- 4736 Willowbrook Dr
- 5900 Walerga Rd Unit 1
- 6020 Ogden Nash Way
- 6018 Ogden Nash Way
- 6016 Ogden Nash Way
- 6024 Ogden Nash Way
- 6014 Ogden Nash Way
- 6026 Ogden Nash Way
- 6012 Ogden Nash Way
- 6028 Ogden Nash Way
- 6019 Ogden Nash Way
- 6023 Ogden Nash Way
- 6017 Ogden Nash Way
- 6010 Ogden Nash Way
- 6030 Ogden Nash Way
- 6015 Ogden Nash Way
- 6008 Ogden Nash Way
- 6013 Ogden Nash Way
- 6011 Ogden Nash Way
- 6032 Ogden Nash Way
- 6049 Ogden Nash Way