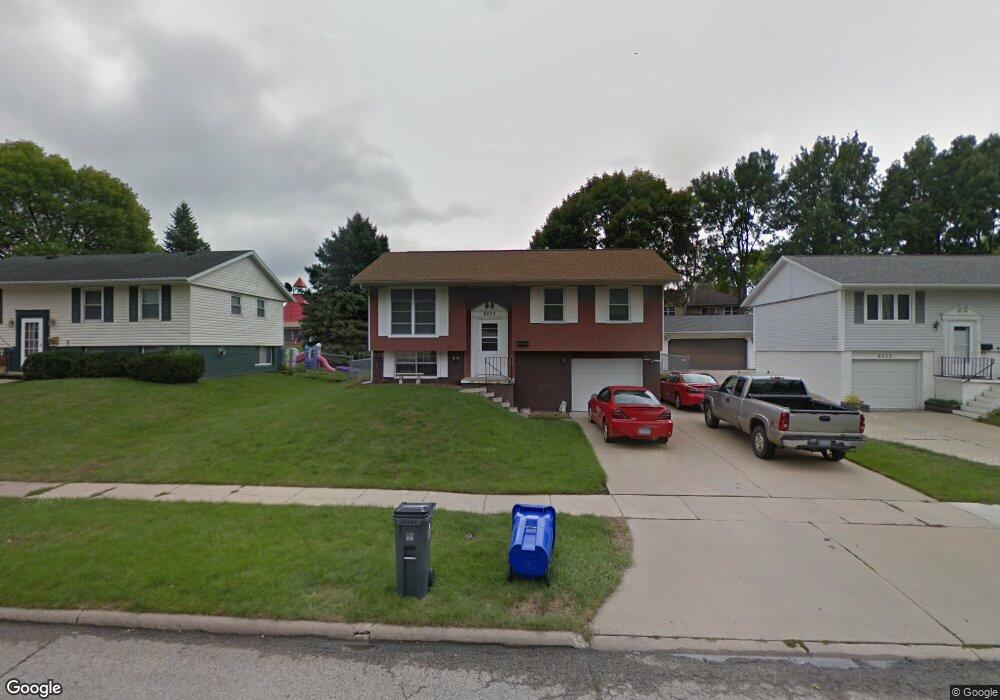
6025 Underwood Ave SW Cedar Rapids, IA 52404
Cherry Hill Park NeighborhoodEstimated Value: $188,981 - $200,000
3
Beds
2
Baths
888
Sq Ft
$220/Sq Ft
Est. Value
About This Home
This home is located at 6025 Underwood Ave SW, Cedar Rapids, IA 52404 and is currently estimated at $195,745, approximately $220 per square foot. 6025 Underwood Ave SW is a home located in Linn County with nearby schools including Junction City Elementary School, West Willow Elementary School, and Bourbon Central Elementary School.
Ownership History
Date
Name
Owned For
Owner Type
Purchase Details
Closed on
Dec 6, 2010
Sold by
Winders Theodore A and Winders Sonja G
Bought by
Winders Theodore A and Winders Sonja G
Current Estimated Value
Purchase Details
Closed on
Nov 9, 2006
Sold by
Hud
Bought by
Winders Theodore A
Purchase Details
Closed on
Aug 16, 2006
Sold by
Mortgage Electronic Registration Systems
Bought by
Hud
Purchase Details
Closed on
Jun 10, 2002
Sold by
Wells Fargo Bank Iowa Na
Bought by
Popelka Travis S
Home Financials for this Owner
Home Financials are based on the most recent Mortgage that was taken out on this home.
Original Mortgage
$81,600
Interest Rate
7.25%
Create a Home Valuation Report for This Property
The Home Valuation Report is an in-depth analysis detailing your home's value as well as a comparison with similar homes in the area
Home Values in the Area
Average Home Value in this Area
Purchase History
| Date | Buyer | Sale Price | Title Company |
|---|---|---|---|
| Winders Theodore A | -- | None Available | |
| Winders Theodore A | -- | None Available | |
| Hud | -- | None Available | |
| Popelka Travis S | $101,500 | -- |
Source: Public Records
Mortgage History
| Date | Status | Borrower | Loan Amount |
|---|---|---|---|
| Previous Owner | Popelka Travis S | $81,600 |
Source: Public Records
Tax History Compared to Growth
Tax History
| Year | Tax Paid | Tax Assessment Tax Assessment Total Assessment is a certain percentage of the fair market value that is determined by local assessors to be the total taxable value of land and additions on the property. | Land | Improvement |
|---|---|---|---|---|
| 2025 | $2,240 | $168,400 | $34,900 | $133,500 |
| 2024 | $2,496 | $154,600 | $30,600 | $124,000 |
| 2023 | $2,496 | $145,700 | $30,600 | $115,100 |
| 2022 | $2,304 | $130,600 | $26,200 | $104,400 |
| 2021 | $2,300 | $123,600 | $26,200 | $97,400 |
| 2020 | $2,300 | $116,100 | $23,300 | $92,800 |
| 2019 | $2,148 | $111,400 | $23,300 | $88,100 |
| 2018 | $2,152 | $111,400 | $23,300 | $88,100 |
| 2017 | $2,152 | $107,600 | $23,300 | $84,300 |
| 2016 | $2,253 | $106,000 | $23,300 | $82,700 |
| 2015 | $2,337 | $109,810 | $23,280 | $86,530 |
| 2014 | $2,152 | $109,810 | $23,280 | $86,530 |
| 2013 | $2,030 | $109,810 | $23,280 | $86,530 |
Source: Public Records
Map
Nearby Homes
- 6118 Greenbriar Ln SW Unit D
- 6305 Greenbriar Ln SW Unit B
- 6008 Eastview Ave SW
- 323 Norwick Rd SW
- 1590 Stoney Pt Rd & 6600 16th Ave SW
- 164 Cherry Hill Rd NW
- 5918 Sharon Ln NW
- 6812 Underwood Ave SW
- 6907 Rock Wood Dr SW
- 150 Meadowlark Ln NW
- 106 Leroy St NW
- 6916 Rock Wood Dr SW
- 509 Grey Slate Dr SW
- 614 Grey Slate Dr SW
- 620 Grey Slate Dr SW
- 200 Cherry Park Dr NW
- 5127 Holly Ave NW
- 225 Rockvalley Ln NW
- 6608 Limestone Ct NW
- 4975 Kesler Rd NW
- 6017 Underwood Ave SW
- 6033 Underwood Ave SW
- 6041 Underwood Ave SW
- 6009 Underwood Ave SW
- 6110 Greenbriar Ln SW
- 6110 Greenbriar Ln SW
- 6110 Greenbriar Ln SW
- 6110 Greenbriar Ln SW
- 6110 Greenbriar Ln SW Unit D
- 6110 Greenbriar Ln SW Unit A
- 6110 Greenbriar Ln SW Unit B
- 6026 Underwood Ave SW
- 6018 Underwood Ave SW
- 6034 Underwood Ave SW
- 6103 Underwood Ave SW
- 6114 Greenbriar Ln SW
- 6114 Greenbriar Ln SW
- 6114 Greenbriar Ln SW
- 6114 Greenbriar Ln SW Unit D
- 6114 Greenbriar Ln SW Unit A