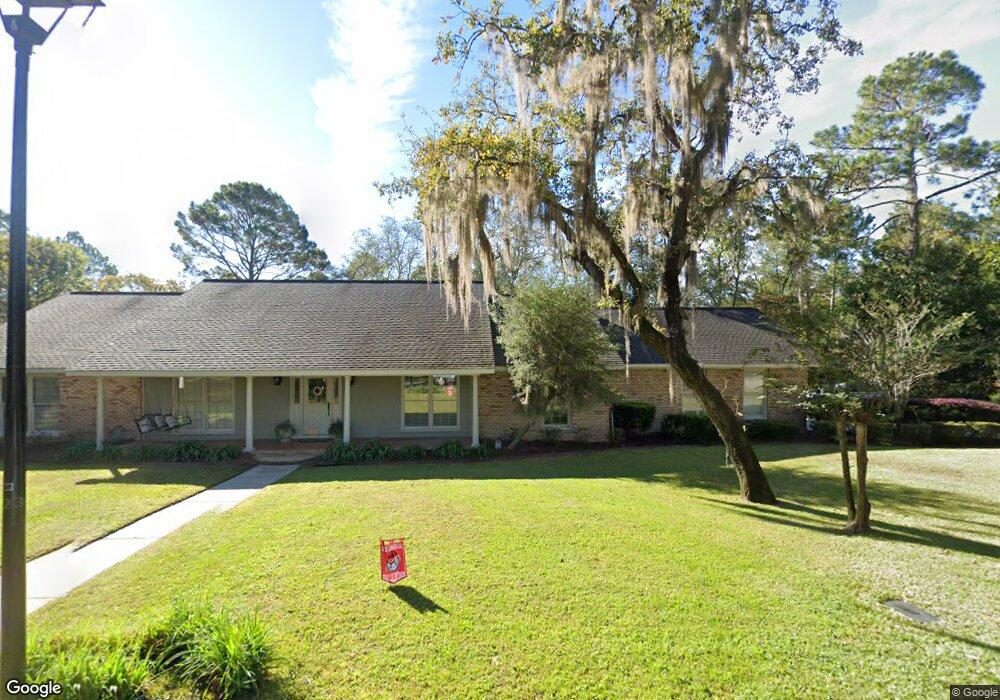
6026 Ridge Trace Blackshear, GA 31516
Estimated Value: $376,614 - $453,000
3
Beds
4
Baths
2,604
Sq Ft
$159/Sq Ft
Est. Value
About This Home
This home is located at 6026 Ridge Trace, Blackshear, GA 31516 and is currently estimated at $413,404, approximately $158 per square foot. 6026 Ridge Trace is a home located in Pierce County with nearby schools including Pierce County High School.
Ownership History
Date
Name
Owned For
Owner Type
Purchase Details
Closed on
Jan 22, 2002
Sold by
Alderman Jerry W and Alderman Lee E
Bought by
Alderman Jerry W and Alderman Lee E
Current Estimated Value
Purchase Details
Closed on
Feb 20, 1996
Sold by
Strickland James D and Strickland Debora S
Bought by
Alderman Jerry W and Alderman Lee E
Purchase Details
Closed on
Oct 15, 1992
Sold by
King Betty Ann
Bought by
Strickland James D and Strickland Debora S
Purchase Details
Closed on
May 18, 1992
Sold by
King Pamela Ann
Bought by
King Betty Ann
Purchase Details
Closed on
Mar 30, 1987
Sold by
Chady Thomas F and Chady Carol J
Bought by
King Eugene C and Betty Ann
Purchase Details
Closed on
Apr 27, 1983
Sold by
Jones W Sherard
Bought by
Chady Thomas F and Chady Carol J
Purchase Details
Closed on
Jul 8, 1982
Sold by
Okefenokee Golf Club Inc
Bought by
Jones W Sherard
Purchase Details
Closed on
Nov 20, 1975
Sold by
Shields John A
Bought by
Okefenokee Golf Club Inc
Create a Home Valuation Report for This Property
The Home Valuation Report is an in-depth analysis detailing your home's value as well as a comparison with similar homes in the area
Home Values in the Area
Average Home Value in this Area
Purchase History
| Date | Buyer | Sale Price | Title Company |
|---|---|---|---|
| Alderman Jerry W | -- | -- | |
| Alderman Jerry W | $145,000 | -- | |
| Strickland James D | $145,000 | -- | |
| King Betty Ann | -- | -- | |
| King Eugene C | $121,000 | -- | |
| Chady Thomas F | $13,500 | -- | |
| Jones W Sherard | $11,500 | -- | |
| Okefenokee Golf Club Inc | $110,000 | -- |
Source: Public Records
Tax History Compared to Growth
Tax History
| Year | Tax Paid | Tax Assessment Tax Assessment Total Assessment is a certain percentage of the fair market value that is determined by local assessors to be the total taxable value of land and additions on the property. | Land | Improvement |
|---|---|---|---|---|
| 2025 | $3,503 | $152,236 | $28,000 | $124,236 |
| 2024 | $3,503 | $149,516 | $28,000 | $121,516 |
| 2023 | $3,476 | $148,372 | $28,000 | $120,372 |
| 2022 | $2,652 | $98,128 | $9,412 | $88,716 |
| 2021 | $2,503 | $94,420 | $9,412 | $85,008 |
| 2020 | $1,650 | $90,712 | $9,412 | $81,300 |
| 2019 | $1,662 | $90,712 | $9,412 | $81,300 |
| 2018 | $1,655 | $87,003 | $9,412 | $77,591 |
| 2017 | $2,306 | $83,946 | $9,412 | $74,534 |
| 2016 | $1,663 | $83,946 | $9,412 | $74,534 |
| 2015 | $1,621 | $83,945 | $9,412 | $74,534 |
| 2014 | $1,621 | $83,946 | $9,412 | $74,534 |
| 2013 | $1,621 | $83,945 | $9,411 | $74,534 |
Source: Public Records
Map
Nearby Homes
- 6121 Fairway Oaks Way
- 1344 River Landing Way
- 6005 & 6007 Tree Top Ln
- 6223 Palmetto Way
- 6435 Riverwoods Dr
- 5927 Yellow Bluff Rd
- 06 Alton Cir
- 03 Alton Cir
- 02 Alton Cir
- 04 Alton Cir
- 01 Alton Cir
- 5768 Holly Dr
- 5802 River Trail
- 5641 Fleetwood Ln
- 1621 Meadowood Dr
- 1691 Huckaby Rd
- 5627 Yellow Bluff Rd
- 2784 Autumn Ridge Ln
- 0 Ash Dr
- 2959 Chadwick Dr
- 6018 Ridge Trace
- 6018 Ridge Trace Rd
- 6038 Ridge Trace
- 6018 Ridge Trace
- 6029 Ridge Trace
- 6029 Ridge Trace Rd
- 6019 Ridge Trace
- 6019 Ridge Trace Rd
- 6010 Ridge Trace
- 6041 Ridge Trace
- 106 Ping Ct
- 6009 Ridge Trace
- 6054 Ridge Trace
- 1338 N River Oaks Dr
- 1346 N River Oaks Dr
- 6045 Ridge Trace
- 1326 N River Oaks Dr
- 6002 Ridge Trace
- 1358 N River Oaks Dr
- 1306 N River Oaks Dr