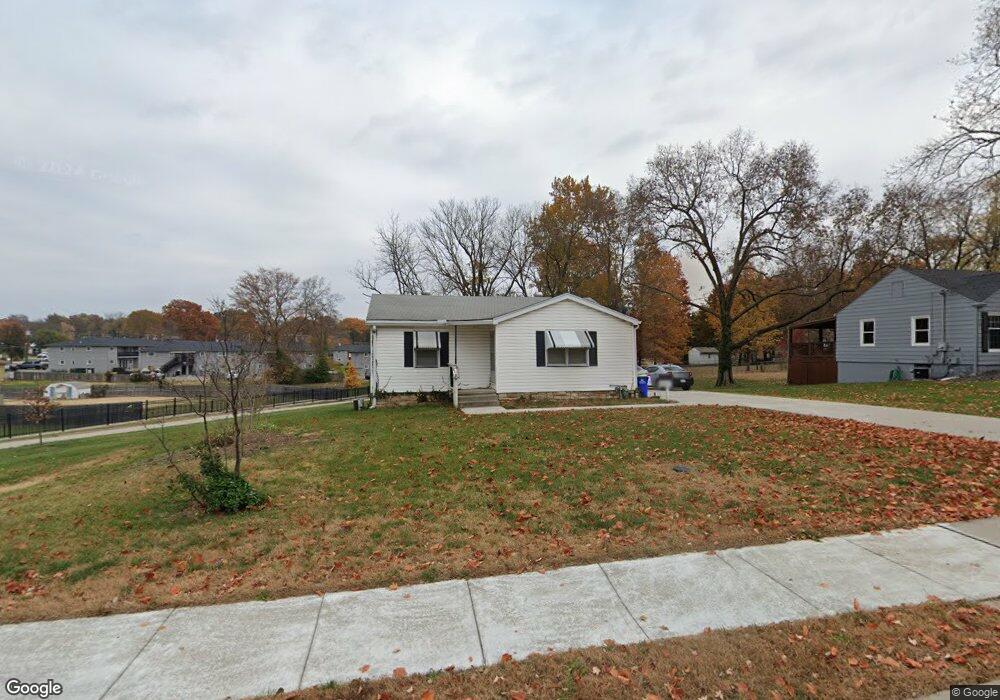
6027 Flint St Shawnee, KS 66203
Estimated Value: $238,000 - $263,094
2
Beds
2
Baths
930
Sq Ft
$276/Sq Ft
Est. Value
About This Home
This home is located at 6027 Flint St, Shawnee, KS 66203 and is currently estimated at $256,774, approximately $276 per square foot. 6027 Flint St is a home located in Johnson County with nearby schools including Bluejacket / Flint Elementary, Hocker Grove Middle School, and Shawnee Mission North High School.
Ownership History
Date
Name
Owned For
Owner Type
Purchase Details
Closed on
May 25, 2018
Sold by
Stevermer Kaye L and Stevermer Revocable Int Kaye L
Bought by
Cardinal Properties Llc
Current Estimated Value
Home Financials for this Owner
Home Financials are based on the most recent Mortgage that was taken out on this home.
Original Mortgage
$64,000
Outstanding Balance
$36,522
Interest Rate
4.4%
Mortgage Type
New Conventional
Estimated Equity
$220,252
Purchase Details
Closed on
Aug 25, 2005
Sold by
Stevermer Kaye L
Bought by
Stevermer Kaye L
Purchase Details
Closed on
Oct 17, 2002
Sold by
Payne Gale E
Bought by
Stevermer Kim O and Stevermer Mary M
Home Financials for this Owner
Home Financials are based on the most recent Mortgage that was taken out on this home.
Original Mortgage
$67,500
Interest Rate
5.4%
Create a Home Valuation Report for This Property
The Home Valuation Report is an in-depth analysis detailing your home's value as well as a comparison with similar homes in the area
Home Values in the Area
Average Home Value in this Area
Purchase History
| Date | Buyer | Sale Price | Title Company |
|---|---|---|---|
| Cardinal Properties Llc | -- | None Available | |
| Stevermer Kaye L | -- | None Available | |
| Stevermer Kim O | $90,000 | Security Land Title Company |
Source: Public Records
Mortgage History
| Date | Status | Borrower | Loan Amount |
|---|---|---|---|
| Open | Cardinal Properties Llc | $64,000 | |
| Previous Owner | Stevermer Kim O | $67,500 |
Source: Public Records
Tax History
| Year | Tax Paid | Tax Assessment Tax Assessment Total Assessment is a certain percentage of the fair market value that is determined by local assessors to be the total taxable value of land and additions on the property. | Land | Improvement |
|---|---|---|---|---|
| 2025 | $2,742 | $26,588 | $5,004 | $21,584 |
| 2023 | $2,595 | $24,288 | $4,860 | $19,428 |
| 2022 | $2,255 | $21,034 | $4,500 | $16,534 |
| 2021 | $2,240 | $19,446 | $3,911 | $15,535 |
| 2020 | $1,971 | $16,859 | $3,550 | $13,309 |
| 2019 | $1,922 | $16,433 | $2,962 | $13,471 |
| 2018 | $1,686 | $14,329 | $2,645 | $11,684 |
| 2017 | $1,659 | $13,881 | $2,645 | $11,236 |
| 2016 | $1,585 | $13,087 | $2,645 | $10,442 |
| 2015 | $1,481 | $12,834 | $2,645 | $10,189 |
| 2013 | -- | $12,317 | $2,645 | $9,672 |
Source: Public Records
Map
Nearby Homes
- 5952 Garnett St
- 11700 Johnson Dr
- 6009 Earnshaw St
- 5734 Cody St
- 6404 Ballentine St
- 6439 Melrose Ln
- 6518 Larsen Ln
- 11935 W 66th St
- 6319 Robinhood Dr
- 6606 Earnshaw St
- 6518 Charles St
- 6517 Melrose Ln
- 10924 W 67th St
- 6556 Charles St
- 5308 Mcanany Dr
- 9719 W 59th Terrace
- 6010 E Richards Dr
- 6524 Westgate Cir
- 6806 Bluejacket St
- 9600 Johnson Dr
- 6021 Flint St
- 6041 Flint St
- 6061 Flint St
- 11402 W 60th Terrace
- 6001 Flint St
- 6024 Flint St
- 11303 W 60th St
- 11406 W 60th Terrace
- 11318 W 61st St
- 11314 W 61st St
- 11315 W 60th St
- 11301 W 60th St
- 11413 W 60th Terrace
- 11222 W 61st St
- 6013 King St
- 6013 King St
- 6013 King St Unit A
- 6009 King St
- 11220 W 61st St
- 11312 W 61st St
Your Personal Tour Guide
Ask me questions while you tour the home.