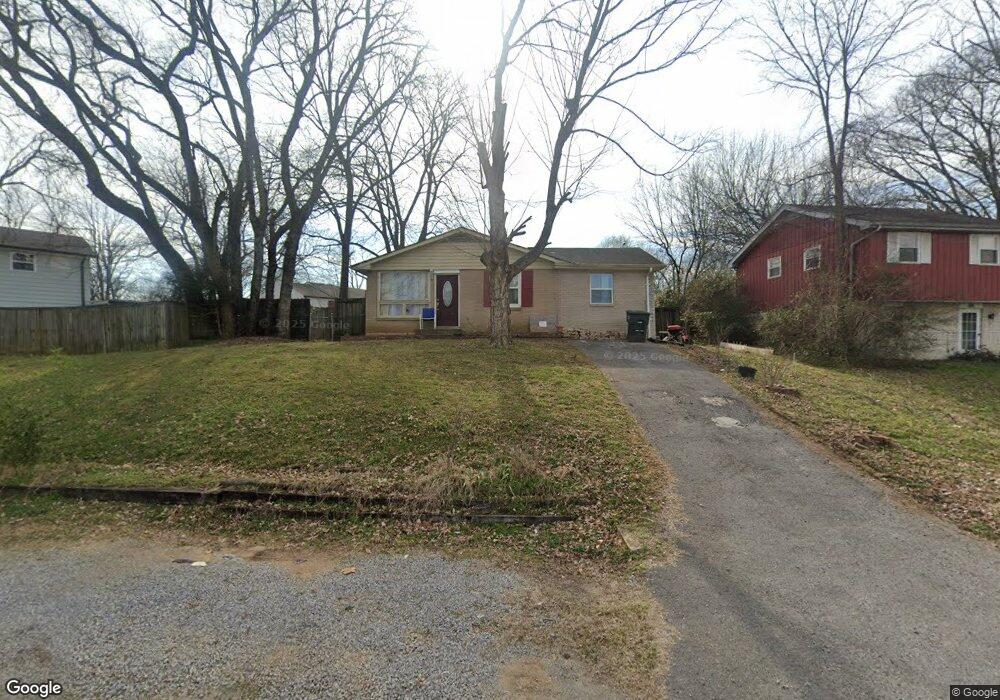
6028 Cortez Ct Hermitage, TN 37076
Hermitage NeighborhoodEstimated Value: $291,000 - $313,000
3
Beds
1
Bath
1,275
Sq Ft
$234/Sq Ft
Est. Value
About This Home
This home is located at 6028 Cortez Ct, Hermitage, TN 37076 and is currently estimated at $298,930, approximately $234 per square foot. 6028 Cortez Ct is a home located in Davidson County with nearby schools including Tulip Grove Elementary School, DuPont Tyler Middle School, and McGavock High School.
Ownership History
Date
Name
Owned For
Owner Type
Purchase Details
Closed on
Oct 26, 2012
Sold by
Ndombe Pedro K
Bought by
Sulcer Morgan
Current Estimated Value
Purchase Details
Closed on
Oct 18, 2011
Sold by
Prosser Donald and Prosser Viola
Bought by
Ndombe Pedro K
Home Financials for this Owner
Home Financials are based on the most recent Mortgage that was taken out on this home.
Original Mortgage
$75,048
Interest Rate
3.5%
Mortgage Type
FHA
Purchase Details
Closed on
Jun 27, 2005
Sold by
Sand Enterprises Llc
Bought by
Prosser Donald and Prosser Viola
Purchase Details
Closed on
Mar 31, 2004
Sold by
Hoskins Kay P and Hoskins Kay P Cooper
Bought by
Sand Enterprises Llc
Home Financials for this Owner
Home Financials are based on the most recent Mortgage that was taken out on this home.
Original Mortgage
$55,130
Interest Rate
5.55%
Mortgage Type
Unknown
Purchase Details
Closed on
Jan 8, 2003
Sold by
Hoskins Kay P Cooper
Bought by
Kennedy David Randy
Create a Home Valuation Report for This Property
The Home Valuation Report is an in-depth analysis detailing your home's value as well as a comparison with similar homes in the area
Home Values in the Area
Average Home Value in this Area
Purchase History
| Date | Buyer | Sale Price | Title Company |
|---|---|---|---|
| Sulcer Morgan | -- | None Available | |
| Ndombe Pedro K | $77,000 | Stewart Title Co Tn Div | |
| Prosser Donald | $78,500 | Realty Title & Escrow Co Inc | |
| Sand Enterprises Llc | $61,254 | -- | |
| Kennedy David Randy | -- | -- |
Source: Public Records
Mortgage History
| Date | Status | Borrower | Loan Amount |
|---|---|---|---|
| Previous Owner | Ndombe Pedro K | $75,048 | |
| Previous Owner | Sand Enterprises Llc | $55,130 |
Source: Public Records
Tax History Compared to Growth
Tax History
| Year | Tax Paid | Tax Assessment Tax Assessment Total Assessment is a certain percentage of the fair market value that is determined by local assessors to be the total taxable value of land and additions on the property. | Land | Improvement |
|---|---|---|---|---|
| 2024 | $1,435 | $49,100 | $13,750 | $35,350 |
| 2023 | $1,435 | $49,100 | $13,750 | $35,350 |
| 2022 | $1,435 | $49,100 | $13,750 | $35,350 |
| 2021 | $1,450 | $49,100 | $13,750 | $35,350 |
| 2020 | $1,125 | $29,700 | $7,500 | $22,200 |
| 2019 | $818 | $29,700 | $7,500 | $22,200 |
| 2018 | $818 | $29,700 | $7,500 | $22,200 |
| 2017 | $818 | $29,700 | $7,500 | $22,200 |
| 2016 | $855 | $21,800 | $5,000 | $16,800 |
| 2015 | $855 | $21,800 | $5,000 | $16,800 |
| 2014 | $855 | $21,800 | $5,000 | $16,800 |
Source: Public Records
Map
Nearby Homes
- 304 Jasmine Park
- 300 Jasmine Park
- 323 Jasmine Park
- 309 Jasmine Park
- 7036 Evans Hill Way
- 1614 Espy Alley
- 452 Harwell Dr
- 428 Old Lebanon Dirt Rd
- 1240 Wallace Way
- 8207 Luree Ln
- 324 Jacksonian Dr
- 417 Harwell Dr
- 413 Hunters Path Ct
- 247 Bonnacroft Dr
- 206 Bonnaoaks Dr
- 4015 Plantation Dr
- 8307 Luree Ln
- 8310 Luree Ln
- 8309 Luree Ln
- 1601 Pakenhams Retreat
- 6026 Cortez Ct
- 6030 Cortez Ct
- 6037 Panama Dr
- 6024 Cortez Ct
- 6035 Panama Dr
- 5337 Bellflower Hills
- 1307 Carriage Park Dr
- 1305 Carriage Park Dr
- 1409 Japonica Alley
- 7301 Blue Gable Rd
- 7309 Blue Gable Rd
- 1413 Japonica Alley
- 1309 Carriage Park Dr
- 1313 Carriage Park Dr
- 1311 Carriage Park Dr
- 7404 Dodd Retreat Ct
- 5377 Bellflower Hills
- 5388 Bellflower Hills
- 5373 Bellflower Hills
- 1317 Carriage Park Dr