Estimated Value: $199,000 - $220,000
--
Bed
3
Baths
1,036
Sq Ft
$202/Sq Ft
Est. Value
About This Home
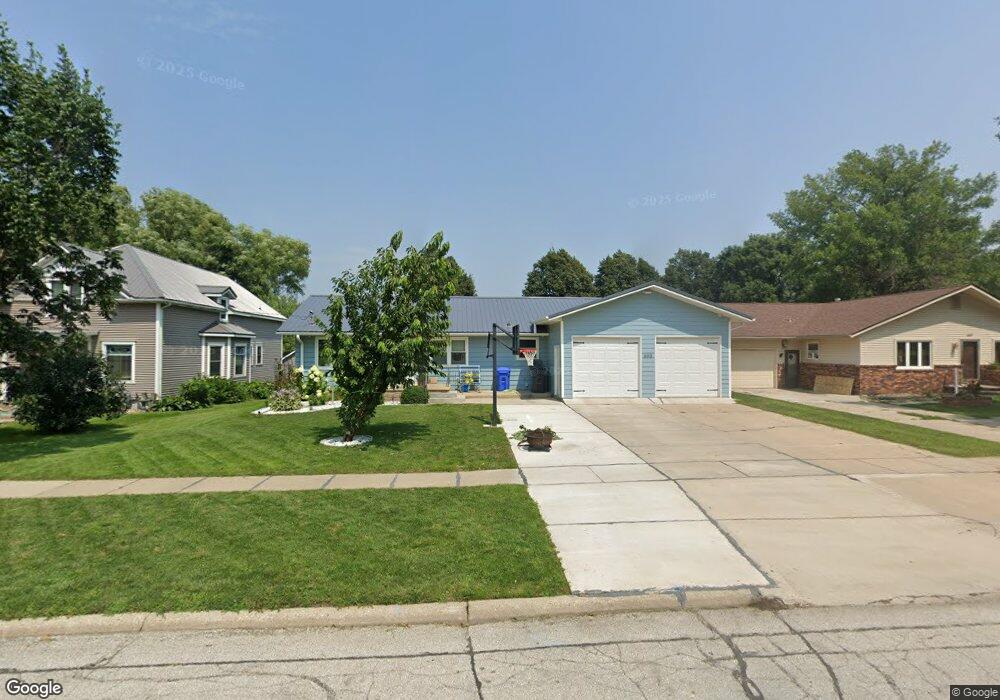
This home is located at 603 2nd St, Hull, IA 51239 and is currently estimated at $209,063, approximately $201 per square foot. 603 2nd St is a home located in Sioux County with nearby schools including Boyden-Hull Elementary School, Boyden-Hull High School, and Hull Christian School.
Ownership History
Date
Name
Owned For
Owner Type
Purchase Details
Closed on
Apr 22, 2016
Sold by
Rozeboom Jay and Rozeboom David
Bought by
Hurley Grant and Hurley Laura
Current Estimated Value
Create a Home Valuation Report for This Property
The Home Valuation Report is an in-depth analysis detailing your home's value as well as a comparison with similar homes in the area
Home Values in the Area
Average Home Value in this Area
Purchase History
| Date | Buyer | Sale Price | Title Company |
|---|---|---|---|
| Hurley Grant | $123,000 | None Available |
Source: Public Records
Tax History Compared to Growth
Tax History
| Year | Tax Paid | Tax Assessment Tax Assessment Total Assessment is a certain percentage of the fair market value that is determined by local assessors to be the total taxable value of land and additions on the property. | Land | Improvement |
|---|---|---|---|---|
| 2025 | $2,852 | $235,500 | $19,250 | $216,250 |
| 2024 | $2,852 | $198,110 | $19,250 | $178,860 |
| 2023 | $2,808 | $198,110 | $19,250 | $178,860 |
| 2022 | $2,708 | $165,480 | $19,250 | $146,230 |
| 2021 | $2,168 | $165,760 | $19,250 | $146,510 |
| 2020 | $2,168 | $127,960 | $19,250 | $108,710 |
| 2019 | $1,912 | $112,430 | $8,750 | $103,680 |
| 2018 | $1,948 | $112,430 | $8,750 | $103,680 |
| 2017 | $1,948 | $112,430 | $8,750 | $103,680 |
| 2014 | $1,408 | $87,790 | $0 | $0 |
Source: Public Records
Map
Nearby Homes