603 2nd St SW Tripoli, IA 50676
Estimated Value: $171,000 - $205,000
3
Beds
2
Baths
1,188
Sq Ft
$160/Sq Ft
Est. Value
About This Home
This home is located at 603 2nd St SW, Tripoli, IA 50676 and is currently estimated at $189,617, approximately $159 per square foot. 603 2nd St SW is a home located in Bremer County with nearby schools including Tripoli Elementary School and Tripoli Middle/High School.
Ownership History
Date
Name
Owned For
Owner Type
Purchase Details
Closed on
Sep 14, 2012
Sold by
Ager Jeff E and Ager Wendy C
Bought by
Christensen Marvin W and Christensen Ashley A
Current Estimated Value
Home Financials for this Owner
Home Financials are based on the most recent Mortgage that was taken out on this home.
Original Mortgage
$131,632
Outstanding Balance
$91,127
Interest Rate
3.58%
Mortgage Type
New Conventional
Estimated Equity
$98,490
Create a Home Valuation Report for This Property
The Home Valuation Report is an in-depth analysis detailing your home's value as well as a comparison with similar homes in the area
Home Values in the Area
Average Home Value in this Area
Purchase History
| Date | Buyer | Sale Price | Title Company |
|---|---|---|---|
| Christensen Marvin W | $129,000 | None Available |
Source: Public Records
Mortgage History
| Date | Status | Borrower | Loan Amount |
|---|---|---|---|
| Open | Christensen Marvin W | $131,632 |
Source: Public Records
Tax History Compared to Growth
Tax History
| Year | Tax Paid | Tax Assessment Tax Assessment Total Assessment is a certain percentage of the fair market value that is determined by local assessors to be the total taxable value of land and additions on the property. | Land | Improvement |
|---|---|---|---|---|
| 2025 | $2,782 | $175,990 | $22,280 | $153,710 |
| 2024 | $2,782 | $170,690 | $22,280 | $148,410 |
| 2023 | $2,644 | $166,550 | $19,800 | $146,750 |
| 2022 | $2,700 | $141,090 | $19,800 | $121,290 |
| 2021 | $2,638 | $141,090 | $19,800 | $121,290 |
| 2020 | $2,638 | $130,020 | $17,330 | $112,690 |
| 2019 | $2,426 | $122,870 | $0 | $0 |
| 2018 | $2,404 | $122,870 | $0 | $0 |
| 2017 | $2,404 | $121,470 | $0 | $0 |
| 2016 | $2,390 | $121,470 | $0 | $0 |
| 2015 | $2,390 | $113,530 | $0 | $0 |
| 2014 | $2,192 | $113,530 | $0 | $0 |
Source: Public Records
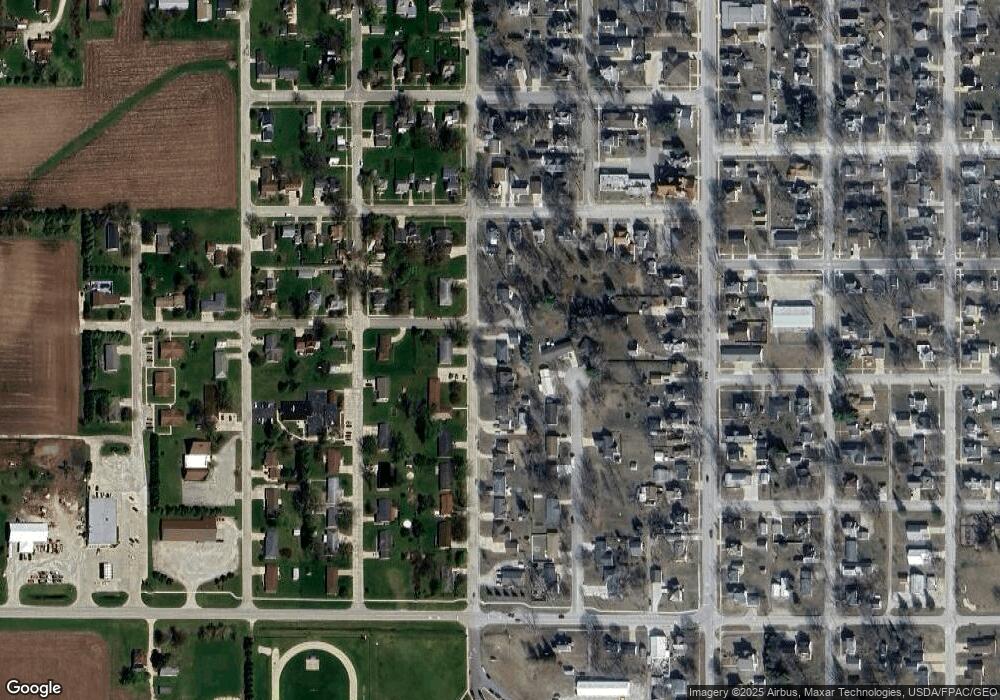
Map
Nearby Homes
- 908 S Main St
- 1000 S Main St
- 904 SE 3rd St
- 1705 Quebec Ave
- 0 Tbd Bare Land 110th St
- TBD Bare Land 110th St
- 2842 220th St
- 2762 110th St
- 726 Malone Ave
- 606 W View Dr
- 307 W Ridge St
- 412 E 4th St
- 109 Meadow Lane Dr
- 320 Yard Dr
- 340 Yard Dr
- 330 Yard Dr
- 325 Yard Dr
- 812 W 4th St
- 709 W 1st St
- 213 N Guilford St