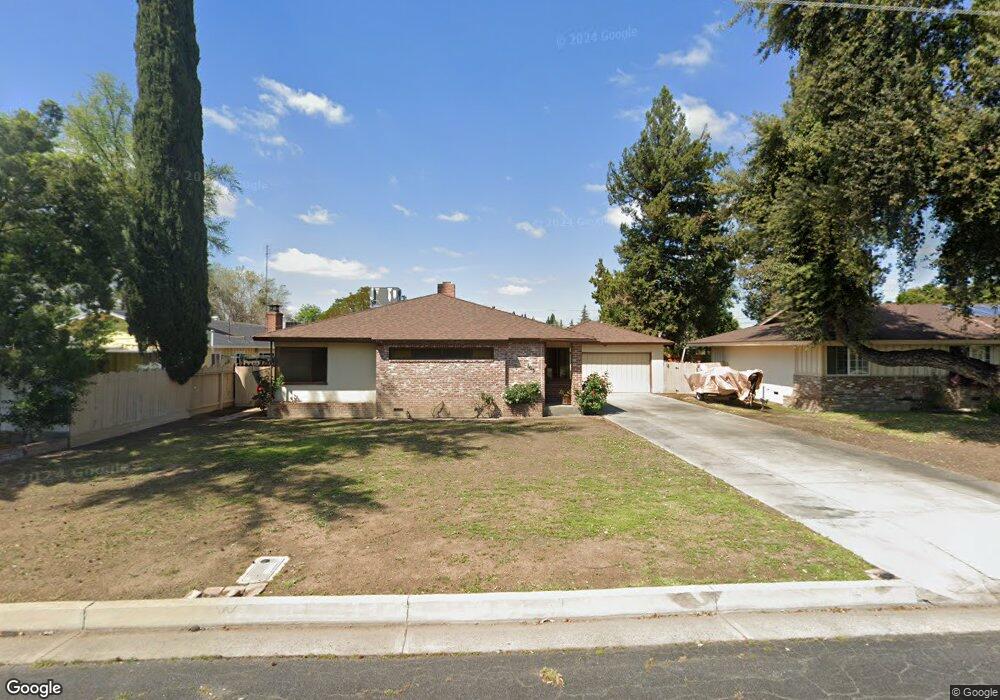
603 Bruce St Madera, CA 93637
West Madera NeighborhoodEstimated Value: $312,943 - $401,000
2
Beds
2
Baths
1,300
Sq Ft
$269/Sq Ft
Est. Value
About This Home
This home is located at 603 Bruce St, Madera, CA 93637 and is currently estimated at $349,486, approximately $268 per square foot. 603 Bruce St is a home located in Madera County with nearby schools including John Adams Elementary School, Thomas Jefferson Middle School, and Madera High School.
Ownership History
Date
Name
Owned For
Owner Type
Purchase Details
Closed on
Jan 26, 2026
Sold by
Bernardi Barbara Jean and Barbara Jean Bernardi Living Trust
Bought by
Bernardi Lora Lee and Gray Carol
Current Estimated Value
Purchase Details
Closed on
Aug 24, 2022
Sold by
Jean Bernardi Barbara
Bought by
Barbara Jean Bernardi Living Trust
Purchase Details
Closed on
Dec 3, 2021
Sold by
Bernardi Barbara J
Bought by
Bernardi Barbara J and Bernardi Loralee
Purchase Details
Closed on
May 31, 2018
Sold by
Unknown
Bought by
Bernardi Lawrence J and Bernardi Barbara J
Purchase Details
Closed on
Jun 7, 2001
Sold by
Capra Janet and Bernardi Lawrence J
Bought by
Capra Marion F and Bernardi Barbara
Create a Home Valuation Report for This Property
The Home Valuation Report is an in-depth analysis detailing your home's value as well as a comparison with similar homes in the area
Home Values in the Area
Average Home Value in this Area
Purchase History
| Date | Buyer | Sale Price | Title Company |
|---|---|---|---|
| Bernardi Lora Lee | -- | None Listed On Document | |
| Barbara Jean Bernardi Living Trust | -- | Jeffrey Wall Pc | |
| Bernardi Barbara J | -- | None Available | |
| Bernardi Lawrence J | -- | None Listed On Document | |
| Capra Marion F | -- | Chicago Title Co |
Source: Public Records
Tax History
| Year | Tax Paid | Tax Assessment Tax Assessment Total Assessment is a certain percentage of the fair market value that is determined by local assessors to be the total taxable value of land and additions on the property. | Land | Improvement |
|---|---|---|---|---|
| 2025 | $590 | $55,708 | $14,171 | $41,537 |
| 2023 | $590 | $53,547 | $13,622 | $39,925 |
| 2022 | $550 | $52,498 | $13,355 | $39,143 |
| 2021 | $538 | $51,470 | $13,094 | $38,376 |
| 2020 | $547 | $50,943 | $12,960 | $37,983 |
| 2019 | $542 | $49,945 | $12,706 | $37,239 |
| 2018 | $500 | $48,966 | $12,457 | $36,509 |
| 2017 | $493 | $48,007 | $12,213 | $35,794 |
| 2016 | $480 | $47,067 | $11,974 | $35,093 |
| 2015 | $447 | $46,361 | $11,795 | $34,566 |
| 2014 | $416 | $45,453 | $11,564 | $33,889 |
Source: Public Records
Map
Nearby Homes
- 174 N Park Dr
- 602 Bruce St
- 1313 de Cesari Ave
- 1237 de Cesari Ave
- 716 Willis Ave
- 1632 University Ave
- 430 Rotan Ave
- 1637 Princeton Ave
- 1803 Sunset Ave
- 991 Baylor Ct
- 15707 Road 22 1 2
- 1312 Riverview Dr
- 815 W Yosemite Ave
- 724 W Yosemite Ave
- 224 S J St
- Avenue 23
- 304 N D St
- 313 S K St
- 820 Columbia St
- 315 S J St
Your Personal Tour Guide
Ask me questions while you tour the home.