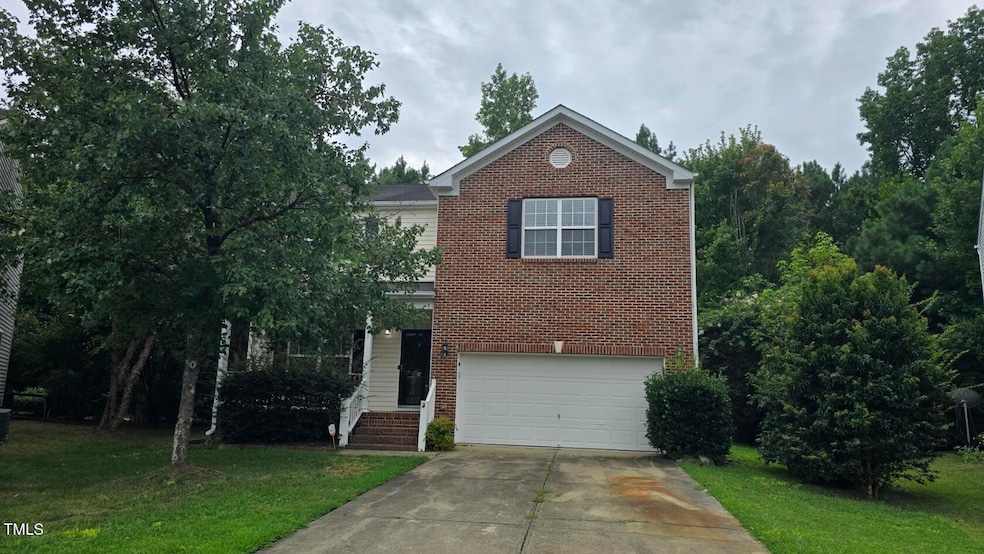
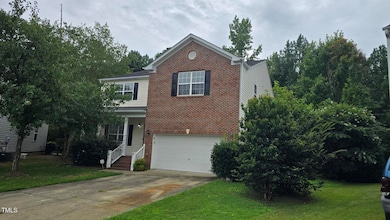
603 Calavaras Ln Knightdale, NC 27545
Estimated payment $2,547/month
Highlights
- Two Primary Bedrooms
- Open Floorplan
- Partially Wooded Lot
- City Lights View
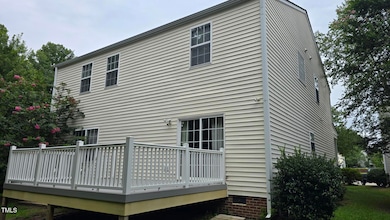
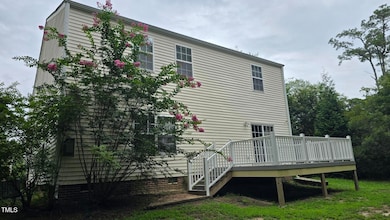
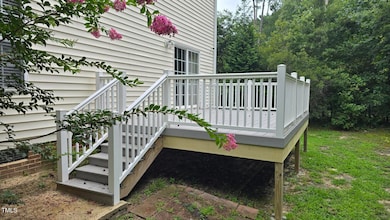
- Deck
- Traditional Architecture
About This Home
Beautifully Updated Single-Family Home in Prime Location!
This well-maintained home offers generous space, an open floor plan, and an unbeatable location—just 5 minutes from Hwy 540, with shopping centers and all daily conveniences right nearby.
Upstairs, the owner has removed all carpet and upgraded to beautiful hardwood floors. The kitchen features elegant granite countertops, and there's a separate formal dining room for special gatherings. Refrigerator, washer, and dryer convey with the home. Enjoy outdoor living on the fully repaired deck, and rest easy knowing the HVAC unit has been recently replaced.
With numerous updates and upgrades throughout, this home is truly move-in ready!
Home Details
Home Type
- Single Family
Est. Annual Taxes
- $4,049
Year Built
- Built in 2005
Lot Details
- 7,841 Sq Ft Lot
- Cul-De-Sac
- Northeast Facing Home
- Landscaped
- Partially Wooded Lot
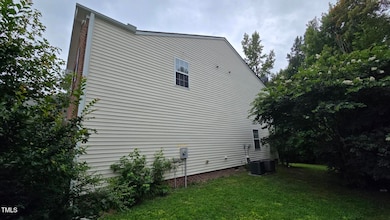
- Back and Front Yard
HOA Fees
- $55 Monthly HOA Fees
Parking
- 2 Car Attached Garage
- Front Facing Garage
- Garage Door Opener
- Private Driveway
Home Design
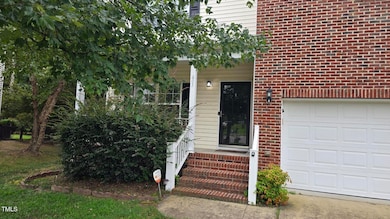
- Traditional Architecture
- Brick Exterior Construction
- Shingle Roof
- Asbestos Shingle Roof
- Composition Roof
- Vinyl Siding
Interior Spaces
- 2,855 Sq Ft Home
- 2-Story Property
- Open Floorplan
- Ceiling Fan
- Gas Fireplace
- Blinds
- Window Screens
- Entrance Foyer
- Family Room with Fireplace
- L-Shaped Dining Room
- Breakfast Room
- City Lights Views
- Crawl Space
- Pull Down Stairs to Attic
- Fire and Smoke Detector
Kitchen
- Electric Oven
- Electric Cooktop
- Range Hood
- Microwave
- Ice Maker
- Dishwasher
- Granite Countertops
- Disposal
Flooring
- Bamboo
- Laminate
- Ceramic Tile
Bedrooms and Bathrooms
- 5 Bedrooms
- Primary bedroom located on second floor
- Double Master Bedroom
- Walk-In Closet
- Bidet
- Separate Shower in Primary Bathroom
- Separate Shower
Laundry
- Laundry Room
- Laundry on main level
- Washer and Dryer
Outdoor Features
- Deck
- Rain Gutters
- Front Porch
Schools
- Wake County Schools Elementary And Middle School
- Wake County Schools High School
Utilities
- Cooling System Powered By Gas
- Forced Air Heating and Cooling System
- Heating System Uses Natural Gas
- Natural Gas Connected
- Gas Water Heater
- High Speed Internet
- Phone Available
- Cable TV Available
Community Details
- Association fees include road maintenance
- Towne Properties Association, Phone Number (513) 381-8696
- Widewaters Village Subdivision
Listing and Financial Details
- Assessor Parcel Number 1744727088
Map
Home Values in the Area
Average Home Value in this Area
Tax History
| Year | Tax Paid | Tax Assessment Tax Assessment Total Assessment is a certain percentage of the fair market value that is determined by local assessors to be the total taxable value of land and additions on the property. | Land | Improvement |
|---|---|---|---|---|
| 2025 | $4,049 | $420,948 | $85,000 | $335,948 |
| 2024 | $4,034 | $420,948 | $85,000 | $335,948 |
| 2023 | $2,971 | $266,576 | $35,000 | $231,576 |
| 2022 | $2,871 | $266,576 | $35,000 | $231,576 |
| 2021 | $2,739 | $266,576 | $35,000 | $231,576 |
| 2020 | $2,739 | $266,576 | $35,000 | $231,576 |
| 2019 | $2,461 | $212,132 | $35,000 | $177,132 |
| 2018 | $2,320 | $212,132 | $35,000 | $177,132 |
| 2017 | $2,237 | $212,132 | $35,000 | $177,132 |
| 2016 | $2,206 | $212,132 | $35,000 | $177,132 |
| 2015 | $2,309 | $219,157 | $32,000 | $187,157 |
| 2014 | $2,229 | $219,157 | $32,000 | $187,157 |
Property History
| Date | Event | Price | List to Sale | Price per Sq Ft |
|---|---|---|---|---|
| 09/05/2025 09/05/25 | Price Changed | $409,000 | -6.8% | $143 / Sq Ft |
| 08/09/2025 08/09/25 | For Sale | $439,000 | -- | $154 / Sq Ft |
Purchase History
| Date | Type | Sale Price | Title Company |
|---|---|---|---|
| Warranty Deed | -- | -- | |
| Warranty Deed | $225,000 | Attorney | |
| Warranty Deed | $188,500 | -- |
Mortgage History
| Date | Status | Loan Amount | Loan Type |
|---|---|---|---|
| Previous Owner | $135,000 | Adjustable Rate Mortgage/ARM | |
| Previous Owner | $150,776 | Fannie Mae Freddie Mac |
Source: Doorify MLS
MLS Number: 10114892
APN: 1744.04-72-7088-000
Disclaimer: Certain information contained herein is derived from information provided by parties other than Homes.com. All information provided is deemed reliable, but is not guaranteed to be accurate and should be independently verified.
![]() Some IDX listings have been excluded from this IDX display. Brokers make an effort to deliver accurate information, but buyers should independently verify any information on which they will rely in a transaction. The listing broker shall not be responsible for any typographical errors, misinformation, or misprints, and they shall be held totally harmless from any damages arising from reliance upon this data. This data is provided exclusively for consumers’ personal, non-commercial use. Listings marked with an icon are provided courtesy of the Doorify MLS, Inc. of North Carolina, Internet Data Exchange Database. Closed (sold) listings may have been listed and/or sold by a real estate firm other than the firm(s) featured on this website. Closed data is not available until the sale of the property is recorded in the MLS. Home sale data is not an appraisal, CMA, competitive or comparative market analysis, or home valuation of any property. Copyright 2025 Doorify MLS, Inc. of North Carolina. All rights reserved.
Some IDX listings have been excluded from this IDX display. Brokers make an effort to deliver accurate information, but buyers should independently verify any information on which they will rely in a transaction. The listing broker shall not be responsible for any typographical errors, misinformation, or misprints, and they shall be held totally harmless from any damages arising from reliance upon this data. This data is provided exclusively for consumers’ personal, non-commercial use. Listings marked with an icon are provided courtesy of the Doorify MLS, Inc. of North Carolina, Internet Data Exchange Database. Closed (sold) listings may have been listed and/or sold by a real estate firm other than the firm(s) featured on this website. Closed data is not available until the sale of the property is recorded in the MLS. Home sale data is not an appraisal, CMA, competitive or comparative market analysis, or home valuation of any property. Copyright 2025 Doorify MLS, Inc. of North Carolina. All rights reserved.
- 1516 Wader Cir
- 1452 Jay Rd
- 1700 Goldfinch Perch Ln
- 444 Haywood Glen Dr
- 1448 Jay Rd
- 810 Steam Boat St
- 619 Laurens Way
- 506 Sternwheel Way
- 104 Saint Johns St
- 2111 Old Rosebud Dr
- 1227 Sunday Silence Dr
- 413 Laurens Way
- 1004 Clay Hill Dr
- 1400 Irving Hill Dr
- 208 George Pine Way Unit 110
- 7912 Flatrock Park Dr
- 4611 Dr
- 117 Stanway Dr
- 603 Pine Forest Trail
- 1209 Agile Dr
- 102 Lake Bridge Ct
- 1001 Park Commons Dr
- 103 St Johns St
- 119 St Johns St
- 1001 Greystone Common Dr
- 107 Elmridge Dr
- 1415 Irving Hill Dr
- 1504 Irving Hill Dr
- 208 Hickory Plains Rd
- 110 Tortola Place
- 907 Ballast Dr
- 604 Brookfield Dr
- 2310 W Cameo Ln
- 303 Indian Springs Dr
- 110 Brookfield Dr
- 1001 Mulford Ct
- 1001 Mulford Ct Unit A1
- 1001 Mulford Ct Unit A2
- 1001 Mulford Ct Unit B1
- 1105 Willowedge Ct
