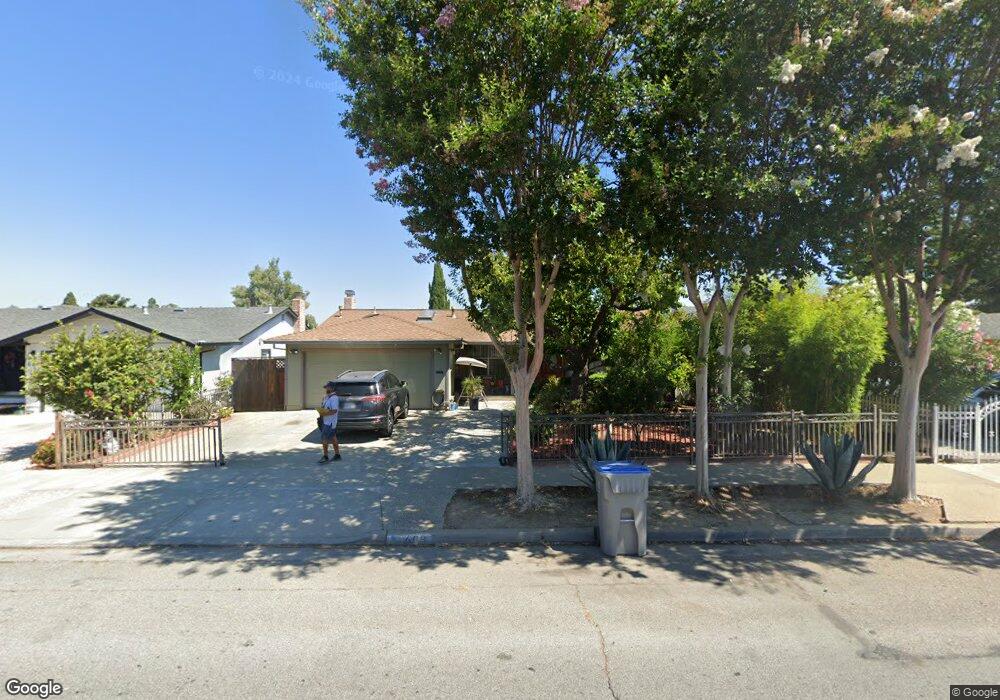
603 Coyote Rd San Jose, CA 95111
Hellyer NeighborhoodEstimated Value: $1,060,000 - $1,231,000
4
Beds
2
Baths
1,572
Sq Ft
$747/Sq Ft
Est. Value
About This Home
This home is located at 603 Coyote Rd, San Jose, CA 95111 and is currently estimated at $1,174,036, approximately $746 per square foot. 603 Coyote Rd is a home located in Santa Clara County with nearby schools including Christopher Elementary School, Davis (Caroline) Intermediate School, and Andrew P. Hill High School.
Ownership History
Date
Name
Owned For
Owner Type
Purchase Details
Closed on
Nov 19, 2010
Sold by
Meza Manuel
Bought by
Nguyen Hiep Mai and Nguyen Thao Thi
Current Estimated Value
Home Financials for this Owner
Home Financials are based on the most recent Mortgage that was taken out on this home.
Original Mortgage
$210,000
Outstanding Balance
$137,918
Interest Rate
4.18%
Mortgage Type
New Conventional
Estimated Equity
$1,036,118
Purchase Details
Closed on
Dec 20, 2005
Sold by
Murguia Socorro
Bought by
Meza Manuel
Home Financials for this Owner
Home Financials are based on the most recent Mortgage that was taken out on this home.
Original Mortgage
$68,400
Interest Rate
6.36%
Mortgage Type
Stand Alone Second
Purchase Details
Closed on
Dec 14, 2005
Sold by
Ruiz Julian N and Ruiz Emma
Bought by
Meza Manuel
Home Financials for this Owner
Home Financials are based on the most recent Mortgage that was taken out on this home.
Original Mortgage
$68,400
Interest Rate
6.36%
Mortgage Type
Stand Alone Second
Create a Home Valuation Report for This Property
The Home Valuation Report is an in-depth analysis detailing your home's value as well as a comparison with similar homes in the area
Home Values in the Area
Average Home Value in this Area
Purchase History
| Date | Buyer | Sale Price | Title Company |
|---|---|---|---|
| Nguyen Hiep Mai | $330,000 | Old Republic Title Company | |
| Meza Manuel | -- | Alliance Title Company | |
| Meza Manuel | $684,500 | Alliance Title Company |
Source: Public Records
Mortgage History
| Date | Status | Borrower | Loan Amount |
|---|---|---|---|
| Open | Nguyen Hiep Mai | $210,000 | |
| Previous Owner | Meza Manuel | $68,400 | |
| Previous Owner | Meza Manuel | $547,600 |
Source: Public Records
Tax History Compared to Growth
Tax History
| Year | Tax Paid | Tax Assessment Tax Assessment Total Assessment is a certain percentage of the fair market value that is determined by local assessors to be the total taxable value of land and additions on the property. | Land | Improvement |
|---|---|---|---|---|
| 2025 | $6,636 | $422,773 | $253,666 | $169,107 |
| 2024 | $6,636 | $414,485 | $248,693 | $165,792 |
| 2023 | $6,507 | $406,359 | $243,817 | $162,542 |
| 2022 | $6,456 | $398,392 | $239,037 | $159,355 |
| 2021 | $6,324 | $390,581 | $234,350 | $156,231 |
| 2020 | $6,161 | $386,578 | $231,948 | $154,630 |
| 2019 | $6,003 | $378,999 | $227,400 | $151,599 |
| 2018 | $5,947 | $371,569 | $222,942 | $148,627 |
| 2017 | $5,862 | $364,284 | $218,571 | $145,713 |
| 2016 | $5,578 | $357,142 | $214,286 | $142,856 |
| 2015 | $5,450 | $351,779 | $211,068 | $140,711 |
| 2014 | $4,851 | $344,889 | $206,934 | $137,955 |
Source: Public Records
Map
Nearby Homes
- 640 Coyote Rd
- 4573 Bolero Dr
- 4171 Ambler Way
- 4219 Senter Rd
- 774 River View Dr
- 352 Via Primavera Dr
- 4614 Houndshaven Way
- 4016 San Bernardino Way
- 355 Otono Ct
- 4996 Eberly Dr
- 403 Mignot Ln
- 490 Ella Dr
- 4320 Monterey Rd Unit 39
- 4943 Rice Dr
- 3535 Pitcairn Way
- 476 Branham Ln E
- 25 Deer Run Cir
- 3891 Marfrance Dr
- 573 Bamboo Ct
- 491 Ginkgo Ct
- 605 Coyote Rd
- 601 Coyote Rd
- 732 River Falls Dr
- 738 River Falls Dr
- 726 River Falls Dr
- 599 Coyote Rd
- 607 Coyote Rd
- 720 River Falls Dr
- 744 River Falls Dr
- 602 Coyote Rd
- 604 Coyote Rd
- 593 Coyote Rd
- 609 Coyote Rd
- 606 Coyote Rd
- 598 Coyote Rd
- 714 River Falls Dr
- 750 River Falls Dr
- 608 Coyote Rd
- 592 Coyote Rd
- 587 Coyote Rd