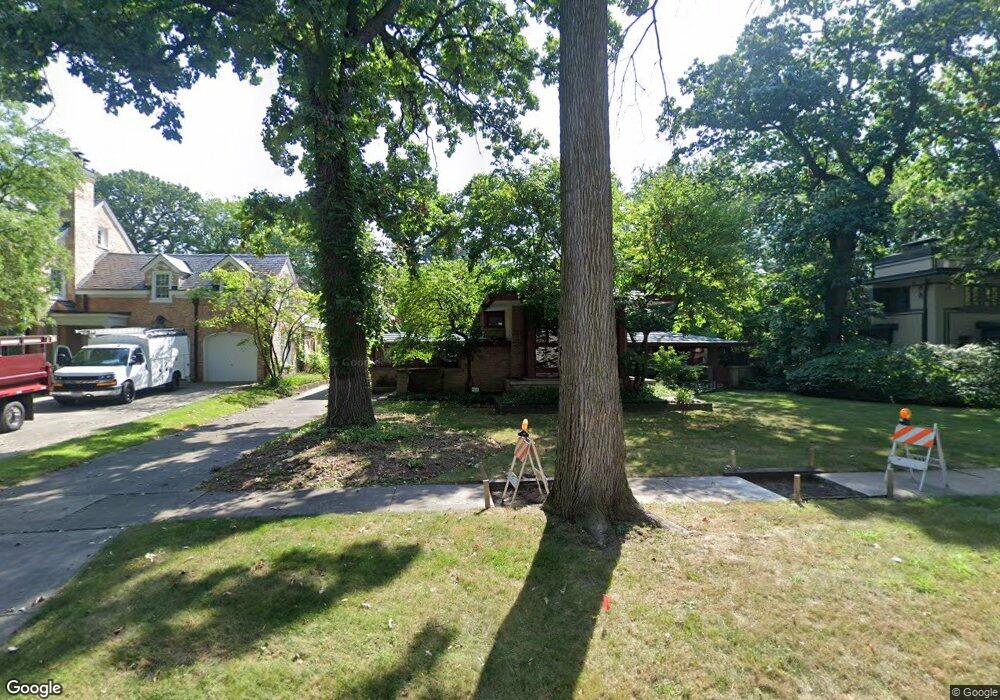
603 Edgewood Place River Forest, IL 60305
Estimated Value: $961,000 - $1,278,000
4
Beds
2
Baths
2,656
Sq Ft
$427/Sq Ft
Est. Value
About This Home
This home is located at 603 Edgewood Place, River Forest, IL 60305 and is currently estimated at $1,134,128, approximately $427 per square foot. 603 Edgewood Place is a home located in Cook County with nearby schools including Lincoln Elementary School, Roosevelt Middle School, and Oak Park and River Forest High School.
Ownership History
Date
Name
Owned For
Owner Type
Purchase Details
Closed on
Mar 15, 2012
Sold by
Peterson Thomas N
Bought by
Peterson Thomas N and Thomas Peterson Trust
Current Estimated Value
Purchase Details
Closed on
Oct 22, 2009
Sold by
Dupont Lorrie A
Bought by
Peterson Thomas N
Purchase Details
Closed on
Dec 21, 2001
Sold by
Peterson Thomas N and Dupont Lorrie A
Bought by
Frank Lloyd Wright Building Conservancy
Purchase Details
Closed on
Aug 1, 2000
Sold by
Pollak William and Pollak Carol T
Bought by
Peterson Thomas N and Dupont Lorrie A
Home Financials for this Owner
Home Financials are based on the most recent Mortgage that was taken out on this home.
Original Mortgage
$550,000
Interest Rate
7.62%
Purchase Details
Closed on
Dec 22, 1997
Sold by
Pollak William and Pollak Carol T
Bought by
Pollak William and Pollak Carol T
Create a Home Valuation Report for This Property
The Home Valuation Report is an in-depth analysis detailing your home's value as well as a comparison with similar homes in the area
Home Values in the Area
Average Home Value in this Area
Purchase History
| Date | Buyer | Sale Price | Title Company |
|---|---|---|---|
| Peterson Thomas N | -- | None Available | |
| Peterson Thomas N | -- | None Available | |
| Frank Lloyd Wright Building Conservancy | -- | -- | |
| Peterson Thomas N | $1,135,000 | -- | |
| Pollak William | -- | -- |
Source: Public Records
Mortgage History
| Date | Status | Borrower | Loan Amount |
|---|---|---|---|
| Previous Owner | Peterson Thomas N | $550,000 |
Source: Public Records
Tax History Compared to Growth
Tax History
| Year | Tax Paid | Tax Assessment Tax Assessment Total Assessment is a certain percentage of the fair market value that is determined by local assessors to be the total taxable value of land and additions on the property. | Land | Improvement |
|---|---|---|---|---|
| 2024 | $20,907 | $79,761 | $23,826 | $55,935 |
| 2023 | $20,442 | $82,338 | $23,826 | $58,512 |
| 2022 | $20,442 | $69,462 | $20,848 | $48,614 |
| 2021 | $19,737 | $69,460 | $20,847 | $48,613 |
| 2020 | $19,410 | $69,460 | $20,847 | $48,613 |
| 2019 | $18,657 | $66,272 | $18,862 | $47,410 |
| 2018 | $19,243 | $71,663 | $18,862 | $52,801 |
| 2017 | $21,763 | $74,319 | $18,862 | $55,457 |
| 2016 | $19,258 | $64,144 | $15,884 | $48,260 |
| 2015 | $19,442 | $64,144 | $15,884 | $48,260 |
| 2014 | $18,847 | $67,676 | $15,884 | $51,792 |
| 2013 | $16,817 | $62,231 | $15,884 | $46,347 |
Source: Public Records
Map
Nearby Homes
- 500 Auvergne Place
- 8129 Lake St
- 8213 Lake St
- 424 Park Ave Unit 205
- 424 Park Ave Unit 204
- 424 Park Ave Unit 206
- 414 Franklin Ave Unit 3A
- 310 S 2nd Ave
- 411 Ashland Ave Unit 1A
- 534 Lathrop Ave
- 407 Ashland Ave Unit 5F
- 407 Ashland Ave Unit 3G
- 7575 Lake St Unit 5C
- 18 Gale Ave
- 608 S 2nd Ave
- 547 Jackson Ave
- 613 Huron St
- 7952 Madison St Unit 2E
- 823 Jackson Ave
- 601 S 6th Ave
- 559 Edgewood Place
- 611 Edgewood Place
- 555 Edgewood Place
- 617 Edgewood Place
- 600 Thatcher Ave
- 623 Edgewood Place
- 547 Edgewood Place
- 606 Thatcher Ave
- 600 Edgewood Place
- 554 Thatcher Ave
- 610 Thatcher Ave
- 560 Edgewood Place
- 543 Edgewood Place
- 616 Thatcher Ave
- 558 Edgewood Place
- 631 Edgewood Place
- 550 Edgewood Place
- 539 Edgewood Place
- 546 Thatcher Ave
- 544 Thatcher Ave