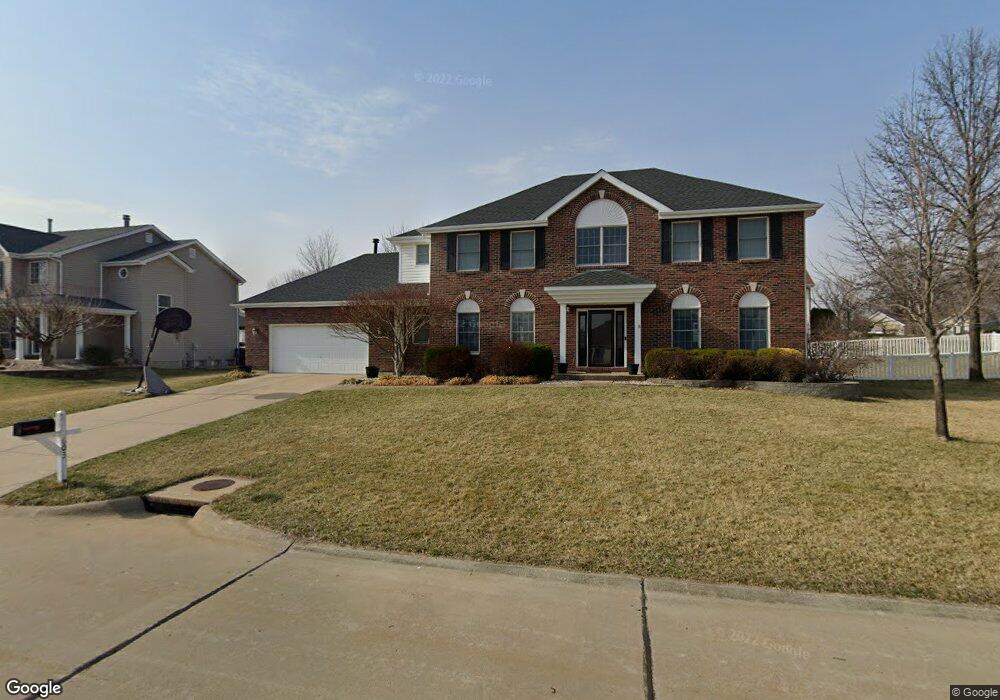
603 Glen Summit Saint Charles, MO 63304
Estimated Value: $555,577 - $602,000
4
Beds
4
Baths
2,722
Sq Ft
$212/Sq Ft
Est. Value
About This Home
This home is located at 603 Glen Summit, Saint Charles, MO 63304 and is currently estimated at $576,394, approximately $211 per square foot. 603 Glen Summit is a home located in St. Charles County with nearby schools including Independence Elementary School, Bryan Middle School, and Francis Howell Union High School.
Ownership History
Date
Name
Owned For
Owner Type
Purchase Details
Closed on
Dec 29, 2011
Sold by
Mack Michael P and Mack Cathy S
Bought by
Sorensen Troy D and Sorensen Rebecca E
Current Estimated Value
Home Financials for this Owner
Home Financials are based on the most recent Mortgage that was taken out on this home.
Original Mortgage
$208,000
Outstanding Balance
$140,794
Interest Rate
4.02%
Mortgage Type
New Conventional
Estimated Equity
$435,600
Purchase Details
Closed on
May 29, 1998
Sold by
Frank E Jackson Inc
Bought by
Mack Michael P and Mack Cathy S
Home Financials for this Owner
Home Financials are based on the most recent Mortgage that was taken out on this home.
Original Mortgage
$170,000
Interest Rate
7.2%
Purchase Details
Closed on
Jan 7, 1998
Sold by
C L Investment Company
Bought by
Frank E Jackson Inc and Jackson Homes
Home Financials for this Owner
Home Financials are based on the most recent Mortgage that was taken out on this home.
Original Mortgage
$172,396
Interest Rate
7.13%
Mortgage Type
Construction
Create a Home Valuation Report for This Property
The Home Valuation Report is an in-depth analysis detailing your home's value as well as a comparison with similar homes in the area
Home Values in the Area
Average Home Value in this Area
Purchase History
| Date | Buyer | Sale Price | Title Company |
|---|---|---|---|
| Sorensen Troy D | $260,000 | None Available | |
| Mack Michael P | -- | -- | |
| Frank E Jackson Inc | -- | -- |
Source: Public Records
Mortgage History
| Date | Status | Borrower | Loan Amount |
|---|---|---|---|
| Open | Sorensen Troy D | $208,000 | |
| Previous Owner | Mack Michael P | $170,000 | |
| Previous Owner | Frank E Jackson Inc | $172,396 |
Source: Public Records
Tax History
| Year | Tax Paid | Tax Assessment Tax Assessment Total Assessment is a certain percentage of the fair market value that is determined by local assessors to be the total taxable value of land and additions on the property. | Land | Improvement |
|---|---|---|---|---|
| 2025 | $5,267 | $97,472 | -- | -- |
| 2023 | $5,265 | $88,366 | $0 | $0 |
| 2022 | $4,335 | $67,529 | $0 | $0 |
| 2021 | $4,339 | $67,529 | $0 | $0 |
| 2020 | $4,511 | $67,985 | $0 | $0 |
| 2019 | $4,490 | $67,985 | $0 | $0 |
| 2018 | $4,150 | $60,042 | $0 | $0 |
| 2017 | $4,116 | $60,042 | $0 | $0 |
| 2016 | $4,254 | $59,788 | $0 | $0 |
| 2015 | $4,217 | $59,788 | $0 | $0 |
| 2014 | $3,989 | $54,861 | $0 | $0 |
Source: Public Records
Map
Nearby Homes
- 3978 Millers Crossing
- 3954 Millers Crossing
- 3912 Jacobs Landing
- 17 Acres on Greens Bottom Rd
- 74 Mondavi Ct
- 6107 Knights Table Ct
- 4024 French Oak Ln
- 64 Castle Bluff Dr
- 42 Windcastle Place
- 350 Healthy Way
- 502 Beneficial Way
- 113 Greenstone Dr
- 742 Oak Leaf Bluff Dr
- 816 Kickshaw Dr
- 1048 Tower Park Dr
- 1100 Tower Park Dr
- 18 Oak Forest Dr
- 978 S Brampton Dr
- 1015 Dingledine Rd
- 4 Haywood Ct
- 1TBB Durham II @ Glen Ridge
- 1TBB Arlington II @ Glen Ridge
- 1TBB Hadleigh @ Glen Ridge
- 1TBB Glenhurst @ Glen Ridge
- 1TBB Wyndham @ Glen Ridge
- 3961 Jacobs Landing
- 611 Glen Summit
- 606 Glen Summit
- 619 Glen Summit
- 3981 Jacobs Landing
- 3936 Jacobs Landing
- 614 Glen Summit
- 3942 Jacobs Landing
- 3948 Millers Crossing
- 3930 Jacobs Landing
- 620 Glen Summit
- 3929 Jacobs Landing
- 635 Glen Summit
- 651 Glen Summit
- 673 Glen Summit
Your Personal Tour Guide
Ask me questions while you tour the home.