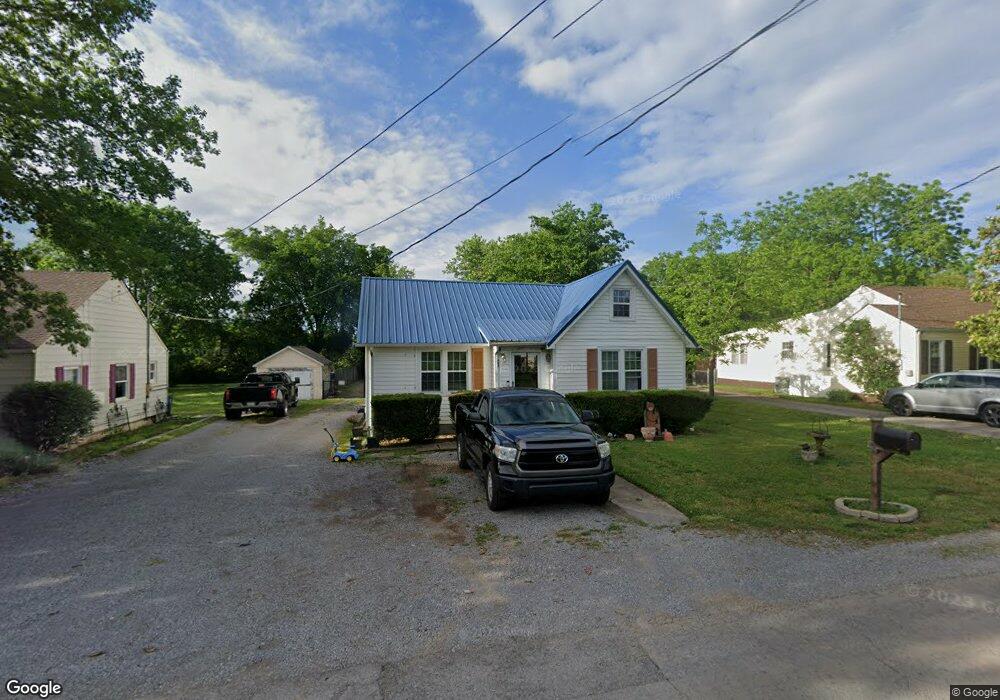
603 Greenwood Ave Shelbyville, TN 37160
Estimated Value: $141,346 - $218,000
--
Bed
1
Bath
992
Sq Ft
$193/Sq Ft
Est. Value
About This Home
This home is located at 603 Greenwood Ave, Shelbyville, TN 37160 and is currently estimated at $191,337, approximately $192 per square foot. 603 Greenwood Ave is a home located in Bedford County with nearby schools including Learning Way Elementary School, Harris Middle School, and Shelbyville Central High School.
Ownership History
Date
Name
Owned For
Owner Type
Purchase Details
Closed on
Jun 12, 2017
Sold by
Ogrady Katiann
Bought by
Martinez Santiago Morales and Garcia Sara A
Current Estimated Value
Home Financials for this Owner
Home Financials are based on the most recent Mortgage that was taken out on this home.
Original Mortgage
$82,365
Outstanding Balance
$68,346
Interest Rate
4.02%
Mortgage Type
Unknown
Estimated Equity
$122,991
Purchase Details
Closed on
Jun 2, 2011
Sold by
Fletcher Robert Clay
Bought by
Legate John
Purchase Details
Closed on
Feb 4, 2000
Sold by
Sudberry Ellis F and Sudberry Dorothy
Bought by
Fletcher Robert C
Purchase Details
Closed on
Mar 15, 1995
Sold by
Lamb Sammie B
Bought by
Ellis Sudberry and Ellis Dorothy
Purchase Details
Closed on
May 11, 1957
Bought by
Lamb Sammie B Mrs
Create a Home Valuation Report for This Property
The Home Valuation Report is an in-depth analysis detailing your home's value as well as a comparison with similar homes in the area
Home Values in the Area
Average Home Value in this Area
Purchase History
| Date | Buyer | Sale Price | Title Company |
|---|---|---|---|
| Martinez Santiago Morales | $96,900 | None Available | |
| Legate John | $48,001 | -- | |
| Fletcher Robert C | $55,000 | -- | |
| Sudberry Ellis F | $35,500 | -- | |
| Ellis Sudberry | $35,500 | -- | |
| Lamb Sammie B Mrs | -- | -- |
Source: Public Records
Mortgage History
| Date | Status | Borrower | Loan Amount |
|---|---|---|---|
| Open | Martinez Santiago Morales | $82,365 |
Source: Public Records
Tax History Compared to Growth
Tax History
| Year | Tax Paid | Tax Assessment Tax Assessment Total Assessment is a certain percentage of the fair market value that is determined by local assessors to be the total taxable value of land and additions on the property. | Land | Improvement |
|---|---|---|---|---|
| 2025 | -- | $24,325 | $0 | $0 |
| 2024 | -- | $24,325 | $3,550 | $20,775 |
| 2023 | $926 | $24,325 | $3,550 | $20,775 |
| 2022 | $953 | $24,325 | $3,550 | $20,775 |
| 2021 | $865 | $24,325 | $3,550 | $20,775 |
| 2020 | $732 | $24,325 | $3,550 | $20,775 |
| 2019 | $732 | $16,525 | $2,625 | $13,900 |
| 2018 | $715 | $16,525 | $2,625 | $13,900 |
| 2017 | $715 | $22,050 | $2,625 | $19,425 |
| 2016 | $708 | $16,525 | $2,625 | $13,900 |
| 2015 | $709 | $16,525 | $2,625 | $13,900 |
| 2014 | $635 | $16,196 | $0 | $0 |
Source: Public Records
Map
Nearby Homes
- 724 Alton Ave
- 636 Deery St
- 703 Deery St
- 714 King Ave
- 713 King Ave
- 112 E Cedar St
- 216 Celebration St
- 610 Sundance St
- 527 Deery St
- 0 Hilltop Rd Unit RTC2897754
- 0 Hilltop Rd Unit RTC3001632
- 1017 Fairfield Pike
- 178 Lucas Rd
- 464 Whitthorne St
- 117 Blue Ribbon Pkwy
- 627 E Lane St
- 631 E Lane St
- 134 Butler St
- 115 Scotland Heights
- 304 Lee Ln
- 601 Greenwood Ave
- 605 Greenwood Ave
- 742 King Ave
- 607 Greenwood Ave
- 737 Hoover St
- 507 Greenwood Ave
- 701 Greenwood Ave
- 740 King Ave
- 739 King Ave
- 735 Hoover St
- 505 Greenwood Ave
- 504 Greenwood Ave
- 703 Greenwood Ave
- 737 King Ave
- 736 King Ave
- 733 Hoover St
- 501 Greenwood Ave
- 742 Alton Ave
- 735 King Ave
- 436 Bird St