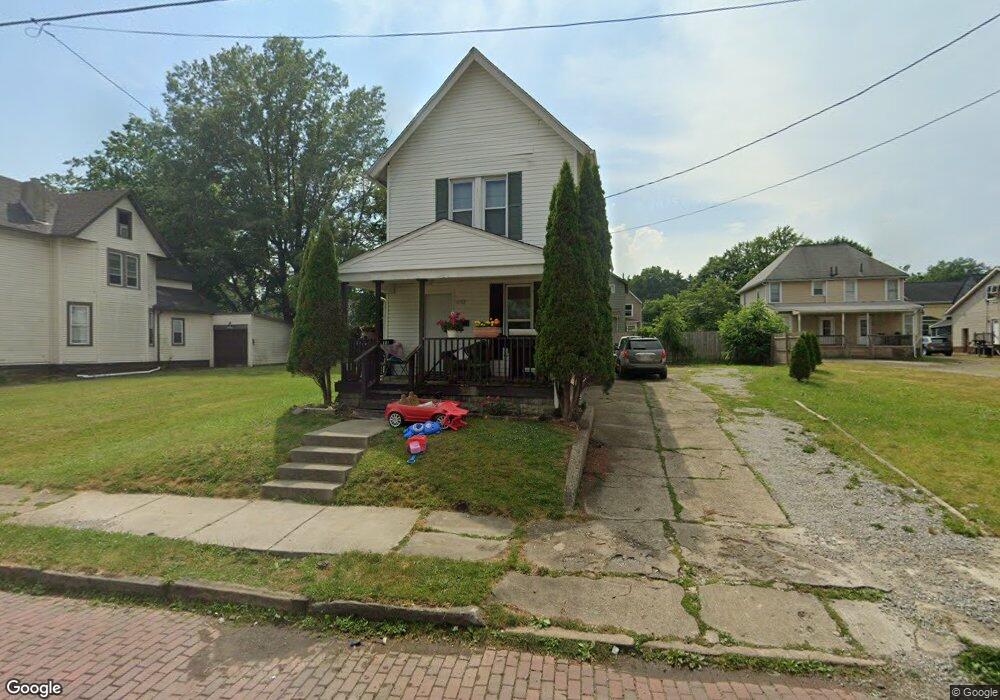
603 Hazlett Ave NW Canton, OH 44708
Edmeyer Park NeighborhoodEstimated Value: $73,995 - $89,000
2
Beds
2
Baths
1,342
Sq Ft
$62/Sq Ft
Est. Value
About This Home
This home is located at 603 Hazlett Ave NW, Canton, OH 44708 and is currently estimated at $82,999, approximately $61 per square foot. 603 Hazlett Ave NW is a home located in Stark County with nearby schools including Early Learning Center @ Schreiber, Harter Elementary School, and Clarendon Intermediate School.
Ownership History
Date
Name
Owned For
Owner Type
Purchase Details
Closed on
Jul 18, 2019
Sold by
Serle Thomas P and Serle Sharon K
Bought by
House To Home Realty Llc
Current Estimated Value
Purchase Details
Closed on
May 29, 2019
Sold by
Neo Realty & Investment Llc
Bought by
Serle Thomas P and Serle Sharon K
Purchase Details
Closed on
Dec 11, 2007
Sold by
Nichols Richard B and Nichols Jackie
Bought by
Neo Realty & Investments Llc
Purchase Details
Closed on
Jul 18, 2007
Sold by
Duetsche Bank National Trust
Bought by
Nichols Richard B
Purchase Details
Closed on
Sep 13, 2006
Sold by
White Michael M and White Belinda S
Bought by
Deutsche Bank National Trust Co and Cdc Mortgage Capital Trust 2003-He2 Mort
Purchase Details
Closed on
Sep 9, 1996
Sold by
Fobes Properties Inc
Bought by
White Michael M
Purchase Details
Closed on
Feb 2, 1993
Purchase Details
Closed on
Jun 3, 1991
Create a Home Valuation Report for This Property
The Home Valuation Report is an in-depth analysis detailing your home's value as well as a comparison with similar homes in the area
Home Values in the Area
Average Home Value in this Area
Purchase History
| Date | Buyer | Sale Price | Title Company |
|---|---|---|---|
| House To Home Realty Llc | $8,000 | Fireland Title | |
| Serle Thomas P | -- | None Available | |
| Neo Realty & Investments Llc | $12,000 | Attorney | |
| Nichols Richard B | $3,500 | Us Land Title Llc | |
| Deutsche Bank National Trust Co | $20,000 | None Available | |
| White Michael M | $13,500 | -- | |
| -- | $10,000 | -- | |
| -- | -- | -- |
Source: Public Records
Tax History Compared to Growth
Tax History
| Year | Tax Paid | Tax Assessment Tax Assessment Total Assessment is a certain percentage of the fair market value that is determined by local assessors to be the total taxable value of land and additions on the property. | Land | Improvement |
|---|---|---|---|---|
| 2025 | $364 | $7,460 | $1,090 | $6,370 |
| 2024 | -- | $7,460 | $1,090 | $6,370 |
| 2023 | $327 | $5,330 | $880 | $4,450 |
| 2022 | $321 | $5,330 | $880 | $4,450 |
| 2021 | $325 | $5,330 | $880 | $4,450 |
| 2020 | $301 | $4,420 | $740 | $3,680 |
| 2019 | $264 | $4,420 | $740 | $3,680 |
| 2018 | $266 | $4,420 | $740 | $3,680 |
| 2017 | $255 | $3,850 | $700 | $3,150 |
| 2016 | $255 | $3,850 | $700 | $3,150 |
| 2015 | $257 | $3,850 | $700 | $3,150 |
| 2014 | $215 | $3,010 | $700 | $2,310 |
| 2013 | $117 | $3,330 | $700 | $2,630 |
Source: Public Records
Map
Nearby Homes
- 435 Hazlett Ave NW
- 202 Lincoln Ave NW
- 201 Park Ave NW
- 1409 8th St NW
- 1405 8th St NW
- 935 Ridge Rd NW
- 1520 11th St NW
- 1221 9th St NW
- 413 Newton Ave NW
- 1111 2nd St NW
- 2425 7th St NW
- 1435 12th St NW
- 807 Bedford Ave NW
- 813 Bedford Ave NW
- 1033 Monnot Place NW
- 521 Columbus Ave NW
- 1024 3rd St NW
- 1023 Fulton Rd NW
- 1015 4th St NW
- 1236 Perkins Ave NW
- 605 Hazlett Ave NW
- 600 Kennet Ct NW
- 515 Hazlett Ave NW
- 609 Hazlett Ave NW
- 518 Kennet Ct NW
- 606 Kennet Ct NW
- 604 Hazlett Ave NW
- 512 Kennet Ct NW
- 602 Hazlett Ave NW
- 507 Hazlett Ave NW
- 507 Hazlett Ave NW Unit A
- 507 Hazlett Ave NW Unit B
- 608 Hazlett Ave NW
- 1700 7th St NW
- 514 Hazlett Ave NW
- 1714 7th St NW
- 1716 7th St NW
- 510 Hazlett Ave NW
- 517 Kennet Ct NW
- 503 Hazlett Ave NW