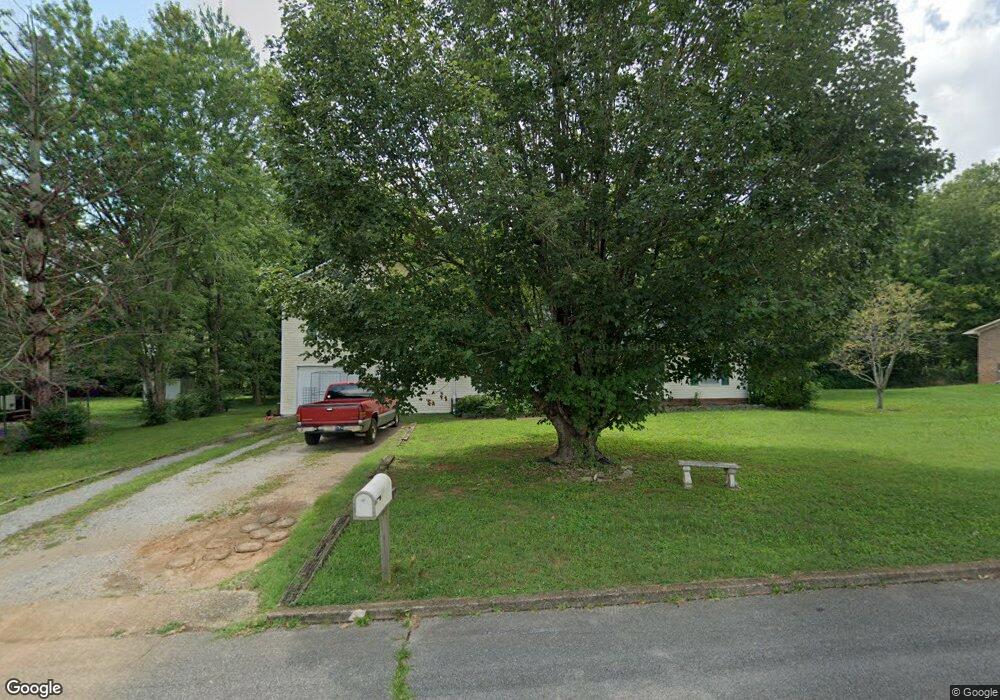
603 Herb Dr Lawrenceburg, TN 38464
Estimated Value: $231,798 - $290,000
--
Bed
2
Baths
1,665
Sq Ft
$157/Sq Ft
Est. Value
About This Home
This home is located at 603 Herb Dr, Lawrenceburg, TN 38464 and is currently estimated at $260,700, approximately $156 per square foot. 603 Herb Dr is a home located in Lawrence County with nearby schools including Ingram Sowell Elementary School, Lawrenceburg Public Elementary School, and David Crockett Elementary School.
Ownership History
Date
Name
Owned For
Owner Type
Purchase Details
Closed on
May 11, 2007
Sold by
John Marston
Bought by
Chambers Katrina C
Current Estimated Value
Home Financials for this Owner
Home Financials are based on the most recent Mortgage that was taken out on this home.
Original Mortgage
$90,000
Outstanding Balance
$54,476
Interest Rate
6.17%
Estimated Equity
$206,224
Purchase Details
Closed on
Jun 18, 1993
Bought by
Marston Ii John
Purchase Details
Closed on
Apr 22, 1993
Bought by
Tice Virginia
Purchase Details
Closed on
Feb 12, 1993
Bought by
Kerstiens Clarence A and Kerstiens Melanie H
Purchase Details
Closed on
Feb 11, 1993
Bought by
Kerstiens Clarence A and Kerstiens Melanie H
Purchase Details
Closed on
Mar 26, 1992
Bought by
Messer Shayne and Messer Jill
Purchase Details
Closed on
May 5, 1987
Bought by
Nelson Richard A and Wife Joni W
Create a Home Valuation Report for This Property
The Home Valuation Report is an in-depth analysis detailing your home's value as well as a comparison with similar homes in the area
Home Values in the Area
Average Home Value in this Area
Purchase History
| Date | Buyer | Sale Price | Title Company |
|---|---|---|---|
| Chambers Katrina C | $100,000 | -- | |
| Marston Ii John | $56,500 | -- | |
| Tice Virginia | $56,400 | -- | |
| Kerstiens Clarence A | -- | -- | |
| Kerstiens Clarence A | -- | -- | |
| Messer Shayne | $52,500 | -- | |
| Nelson Richard A | -- | -- |
Source: Public Records
Mortgage History
| Date | Status | Borrower | Loan Amount |
|---|---|---|---|
| Open | Nelson Richard A | $90,000 |
Source: Public Records
Tax History Compared to Growth
Tax History
| Year | Tax Paid | Tax Assessment Tax Assessment Total Assessment is a certain percentage of the fair market value that is determined by local assessors to be the total taxable value of land and additions on the property. | Land | Improvement |
|---|---|---|---|---|
| 2025 | $1,398 | $44,975 | $0 | $0 |
| 2024 | $1,398 | $44,975 | $4,375 | $40,600 |
| 2023 | $1,398 | $44,975 | $4,375 | $40,600 |
| 2022 | $1,398 | $44,975 | $4,375 | $40,600 |
| 2021 | $1,081 | $24,600 | $2,250 | $22,350 |
| 2020 | $1,081 | $24,600 | $2,250 | $22,350 |
| 2019 | $1,081 | $24,600 | $2,250 | $22,350 |
| 2018 | $1,081 | $24,600 | $2,250 | $22,350 |
| 2017 | $1,081 | $24,600 | $2,250 | $22,350 |
| 2016 | $1,081 | $24,600 | $2,250 | $22,350 |
| 2015 | $1,024 | $24,600 | $2,250 | $22,350 |
| 2014 | $1,013 | $24,350 | $2,250 | $22,100 |
Source: Public Records
Map
Nearby Homes