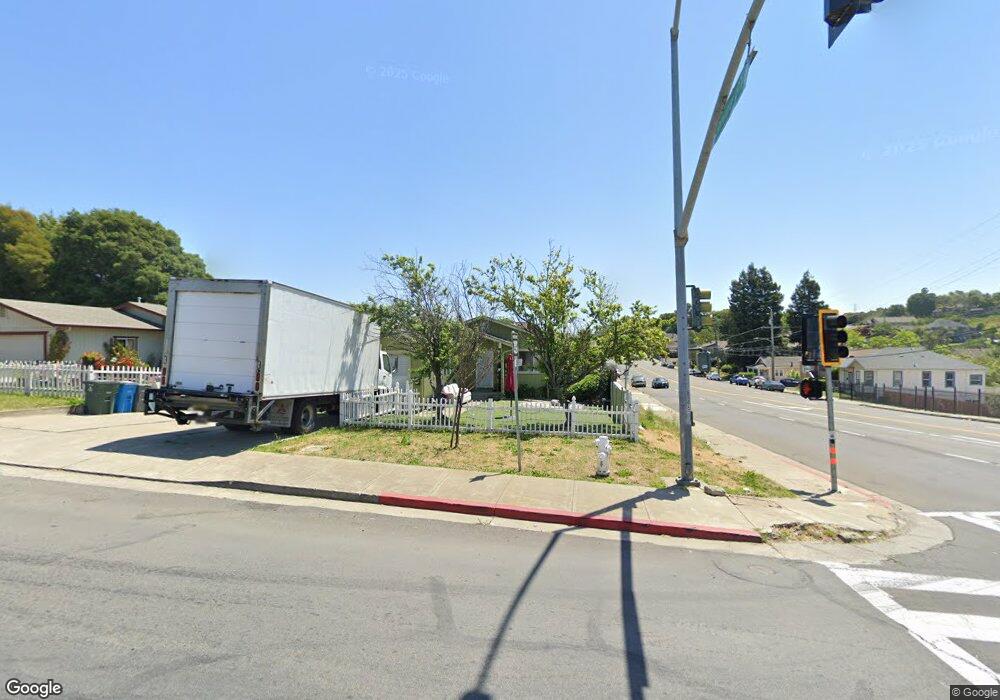
603 Lemon St Vallejo, CA 94590
South Vallejo NeighborhoodEstimated Value: $382,000 - $420,306
3
Beds
2
Baths
1,148
Sq Ft
$354/Sq Ft
Est. Value
About This Home
This home is located at 603 Lemon St, Vallejo, CA 94590 and is currently estimated at $405,827, approximately $353 per square foot. 603 Lemon St is a home located in Solano County with nearby schools including Grace Patterson Elementary School, Vallejo High School, and Caliber: ChangeMakers Academy.
Ownership History
Date
Name
Owned For
Owner Type
Purchase Details
Closed on
Jan 5, 2024
Sold by
Persistent Offer Inc
Bought by
Holla Living Trust and Holla
Current Estimated Value
Purchase Details
Closed on
Feb 4, 2022
Sold by
Releases Remises
Bought by
Sonia Annette Grady Trust
Purchase Details
Closed on
Jan 13, 2000
Sold by
Vjo Neighborhood Hsing Srv Inc
Bought by
Grady Sonia A
Home Financials for this Owner
Home Financials are based on the most recent Mortgage that was taken out on this home.
Original Mortgage
$84,500
Interest Rate
8.18%
Mortgage Type
Stand Alone First
Purchase Details
Closed on
Aug 6, 1998
Sold by
Vjo Neighborhood Hsing Srv Inc
Bought by
Vallejo Neighborhood Housing Svcs Inc
Create a Home Valuation Report for This Property
The Home Valuation Report is an in-depth analysis detailing your home's value as well as a comparison with similar homes in the area
Home Values in the Area
Average Home Value in this Area
Purchase History
| Date | Buyer | Sale Price | Title Company |
|---|---|---|---|
| Holla Living Trust | $400,000 | First American Title | |
| Persistent Offer Inc | $340,000 | First American Title | |
| Sonia Annette Grady Trust | -- | None Listed On Document | |
| Grady Sonia A | $125,000 | Frontier Title Company | |
| Vallejo Neighborhood Housing Svcs Inc | -- | Frontier Title Company |
Source: Public Records
Mortgage History
| Date | Status | Borrower | Loan Amount |
|---|---|---|---|
| Previous Owner | Grady Sonia A | $84,500 | |
| Closed | Grady Sonia A | $42,333 |
Source: Public Records
Tax History Compared to Growth
Tax History
| Year | Tax Paid | Tax Assessment Tax Assessment Total Assessment is a certain percentage of the fair market value that is determined by local assessors to be the total taxable value of land and additions on the property. | Land | Improvement |
|---|---|---|---|---|
| 2025 | $3,367 | $408,000 | $122,400 | $285,600 |
| 2024 | $3,367 | $188,339 | $52,732 | $135,607 |
| 2023 | $3,045 | $184,648 | $51,699 | $132,949 |
| 2022 | $2,943 | $181,029 | $50,686 | $130,343 |
| 2021 | $2,666 | $177,481 | $49,693 | $127,788 |
| 2020 | $2,669 | $175,662 | $49,184 | $126,478 |
| 2019 | $2,629 | $172,219 | $48,220 | $123,999 |
| 2018 | $2,454 | $168,843 | $47,275 | $121,568 |
| 2017 | $2,333 | $165,534 | $46,349 | $119,185 |
| 2016 | $1,814 | $162,290 | $45,441 | $116,849 |
| 2015 | $1,789 | $159,853 | $44,759 | $115,094 |
| 2014 | $1,763 | $156,723 | $43,883 | $112,840 |
Source: Public Records
Map
Nearby Homes