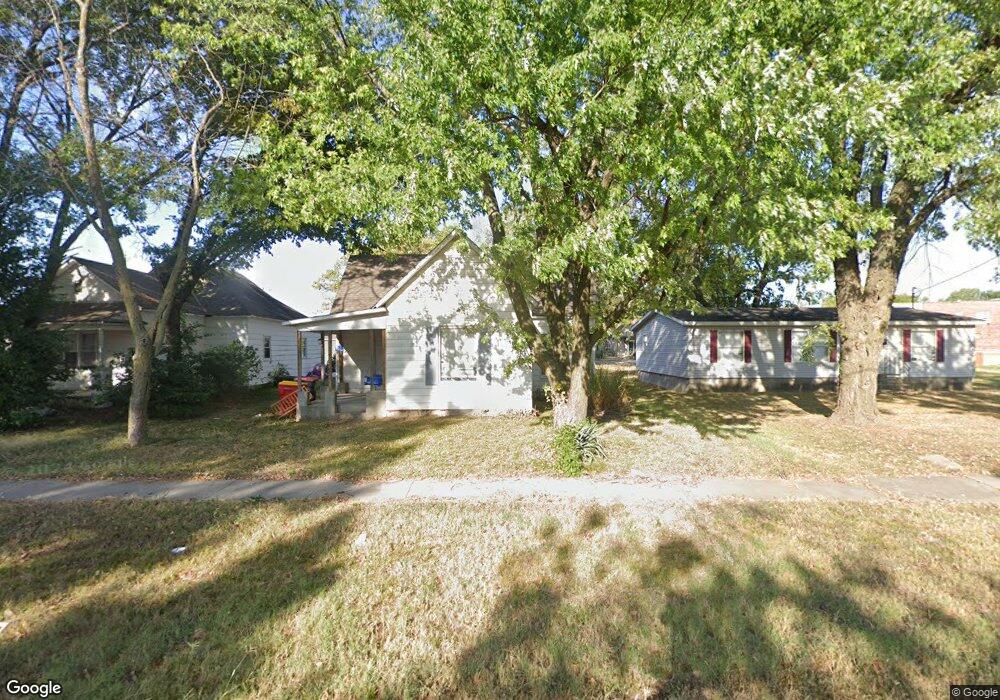
603 N Joplin St Pittsburg, KS 66762
Estimated Value: $69,136 - $111,000
3
Beds
1
Bath
1,094
Sq Ft
$76/Sq Ft
Est. Value
About This Home
This home is located at 603 N Joplin St, Pittsburg, KS 66762 and is currently estimated at $82,784, approximately $75 per square foot. 603 N Joplin St is a home located in Crawford County with nearby schools including Meadowlark Elementary School, Pittsburg Middle School, and Pittsburg High School.
Ownership History
Date
Name
Owned For
Owner Type
Purchase Details
Closed on
Sep 5, 2023
Sold by
Quincy Real Estate Llc
Bought by
Preston Marrs
Current Estimated Value
Home Financials for this Owner
Home Financials are based on the most recent Mortgage that was taken out on this home.
Original Mortgage
$46,400
Outstanding Balance
$45,459
Interest Rate
7.2%
Mortgage Type
Construction
Estimated Equity
$37,325
Purchase Details
Closed on
Nov 15, 2012
Sold by
Mcclure Paul R
Bought by
Quincy Real Estate Llc
Create a Home Valuation Report for This Property
The Home Valuation Report is an in-depth analysis detailing your home's value as well as a comparison with similar homes in the area
Home Values in the Area
Average Home Value in this Area
Purchase History
| Date | Buyer | Sale Price | Title Company |
|---|---|---|---|
| Preston Marrs | $58,000 | Crawford Cnty Abstract Co Inc | |
| Quincy Real Estate Llc | -- | -- | |
| Quincy Real Estate Llc | -- | -- |
Source: Public Records
Mortgage History
| Date | Status | Borrower | Loan Amount |
|---|---|---|---|
| Open | Preston Marrs | $46,400 |
Source: Public Records
Tax History Compared to Growth
Tax History
| Year | Tax Paid | Tax Assessment Tax Assessment Total Assessment is a certain percentage of the fair market value that is determined by local assessors to be the total taxable value of land and additions on the property. | Land | Improvement |
|---|---|---|---|---|
| 2025 | $774 | $5,888 | $798 | $5,090 |
| 2024 | $774 | $5,780 | $798 | $4,982 |
| 2023 | $242 | $1,817 | $758 | $1,059 |
| 2022 | $111 | $816 | $512 | $304 |
| 2021 | $99 | $724 | $512 | $212 |
| 2020 | $99 | $724 | $512 | $212 |
| 2019 | $99 | $724 | $512 | $212 |
| 2018 | $98 | $724 | $512 | $212 |
| 2017 | $98 | $724 | $512 | $212 |
| 2016 | $97 | $724 | $512 | $212 |
| 2015 | $392 | $723 | $493 | $230 |
| 2014 | $392 | $723 | $493 | $230 |
Source: Public Records
Map
Nearby Homes