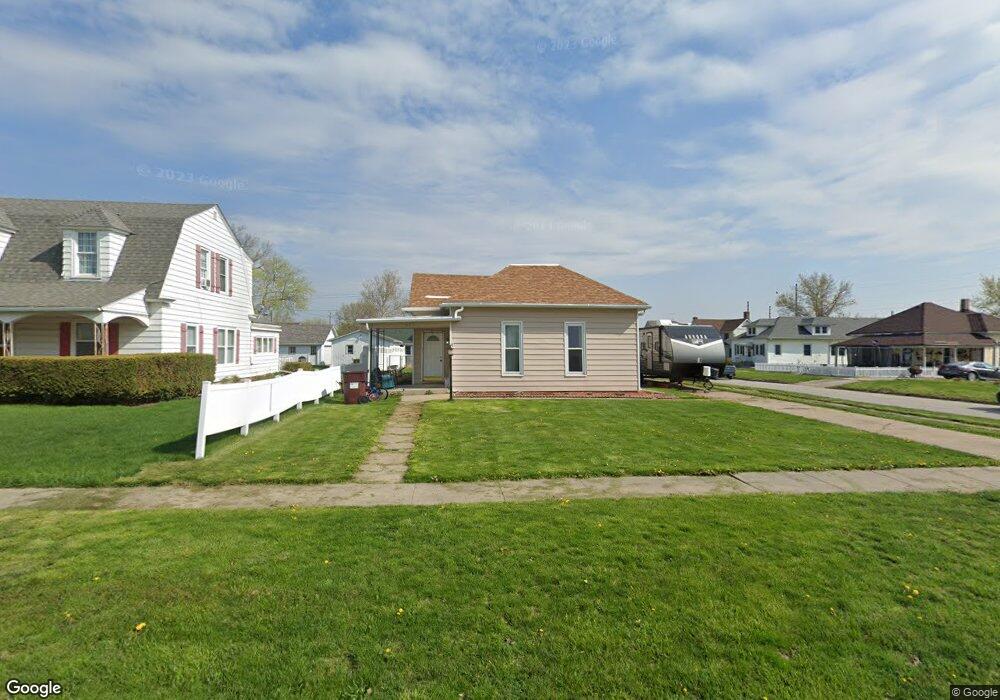
603 Osage Ave Chariton, IA 50049
Estimated Value: $84,000 - $105,000
--
Bed
--
Bath
1,333
Sq Ft
$70/Sq Ft
Est. Value
About This Home
This home is located at 603 Osage Ave, Chariton, IA 50049 and is currently estimated at $93,667, approximately $70 per square foot. 603 Osage Ave is a home located in Lucas County with nearby schools including Van Allen Elementary School, Columbus Elementary School, and Chariton Middle School.
Ownership History
Date
Name
Owned For
Owner Type
Purchase Details
Closed on
May 2, 2025
Sold by
Bellon Carlee
Bought by
Cbyers Rentals Llc
Current Estimated Value
Purchase Details
Closed on
Aug 12, 2021
Sold by
Sue Swanson Kerry
Bought by
Bellon Carlee
Home Financials for this Owner
Home Financials are based on the most recent Mortgage that was taken out on this home.
Original Mortgage
$61,110
Interest Rate
2.9%
Mortgage Type
New Conventional
Create a Home Valuation Report for This Property
The Home Valuation Report is an in-depth analysis detailing your home's value as well as a comparison with similar homes in the area
Home Values in the Area
Average Home Value in this Area
Purchase History
| Date | Buyer | Sale Price | Title Company |
|---|---|---|---|
| Cbyers Rentals Llc | $90,000 | None Listed On Document | |
| Bellon Carlee | $63,000 | None Listed On Document |
Source: Public Records
Mortgage History
| Date | Status | Borrower | Loan Amount |
|---|---|---|---|
| Previous Owner | Bellon Carlee | $61,110 |
Source: Public Records
Tax History Compared to Growth
Tax History
| Year | Tax Paid | Tax Assessment Tax Assessment Total Assessment is a certain percentage of the fair market value that is determined by local assessors to be the total taxable value of land and additions on the property. | Land | Improvement |
|---|---|---|---|---|
| 2024 | $1,812 | $93,531 | $21,168 | $72,363 |
| 2023 | $1,172 | $93,531 | $21,168 | $72,363 |
| 2022 | $2,196 | $57,391 | $10,600 | $46,791 |
| 2021 | $1,910 | $94,100 | $10,600 | $83,500 |
| 2020 | $1,910 | $78,414 | $8,833 | $69,581 |
| 2019 | $1,774 | $147,995 | $78,414 | $69,581 |
| 2018 | $1,756 | $68,186 | $7,681 | $60,505 |
| 2017 | $1,756 | $64,326 | $0 | $0 |
| 2016 | $1,704 | $64,326 | $0 | $0 |
| 2015 | $1,704 | $64,326 | $0 | $0 |
| 2014 | $1,700 | $64,326 | $0 | $0 |
Source: Public Records
Map
Nearby Homes