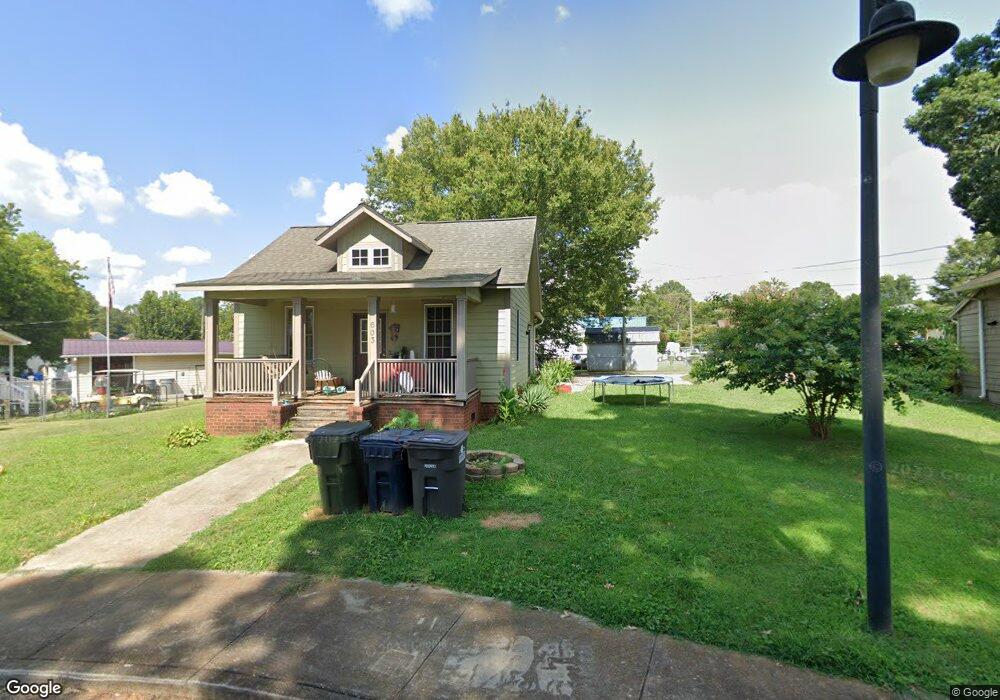
603 Park Cir Lexington, NC 27295
Estimated Value: $170,000 - $194,000
3
Beds
2
Baths
1,275
Sq Ft
$141/Sq Ft
Est. Value
About This Home
This home is located at 603 Park Cir, Lexington, NC 27295 and is currently estimated at $180,280, approximately $141 per square foot. 603 Park Cir is a home with nearby schools including South Lexington School, Lexington Middle School, and Lexington Senior High School.
Ownership History
Date
Name
Owned For
Owner Type
Purchase Details
Closed on
Apr 26, 2011
Sold by
City Of Lexington
Bought by
Spradling Nicole
Current Estimated Value
Home Financials for this Owner
Home Financials are based on the most recent Mortgage that was taken out on this home.
Original Mortgage
$70,684
Outstanding Balance
$49,099
Interest Rate
4.87%
Mortgage Type
FHA
Estimated Equity
$131,181
Purchase Details
Closed on
Dec 18, 2009
Sold by
Beck Timothy B and Beck Regina P
Bought by
City Of Lexington
Purchase Details
Closed on
Mar 1, 1994
Create a Home Valuation Report for This Property
The Home Valuation Report is an in-depth analysis detailing your home's value as well as a comparison with similar homes in the area
Home Values in the Area
Average Home Value in this Area
Purchase History
| Date | Buyer | Sale Price | Title Company |
|---|---|---|---|
| Spradling Nicole | $85,000 | None Available | |
| City Of Lexington | $20,000 | None Available | |
| -- | -- | -- |
Source: Public Records
Mortgage History
| Date | Status | Borrower | Loan Amount |
|---|---|---|---|
| Open | Spradling Nicole | $70,684 |
Source: Public Records
Tax History Compared to Growth
Tax History
| Year | Tax Paid | Tax Assessment Tax Assessment Total Assessment is a certain percentage of the fair market value that is determined by local assessors to be the total taxable value of land and additions on the property. | Land | Improvement |
|---|---|---|---|---|
| 2025 | $1,385 | $106,500 | $0 | $0 |
| 2024 | $1,385 | $106,500 | $0 | $0 |
| 2023 | $1,385 | $106,500 | $0 | $0 |
| 2022 | $1,385 | $106,500 | $0 | $0 |
| 2021 | $1,385 | $106,500 | $0 | $0 |
| 2020 | $1,018 | $78,860 | $0 | $0 |
| 2019 | $1,033 | $78,860 | $0 | $0 |
| 2018 | $1,033 | $78,860 | $0 | $0 |
| 2017 | $1,033 | $78,860 | $0 | $0 |
| 2016 | $1,033 | $78,860 | $0 | $0 |
| 2015 | $994 | $78,860 | $0 | $0 |
| 2014 | $1,145 | $90,870 | $0 | $0 |
Source: Public Records
Map
Nearby Homes