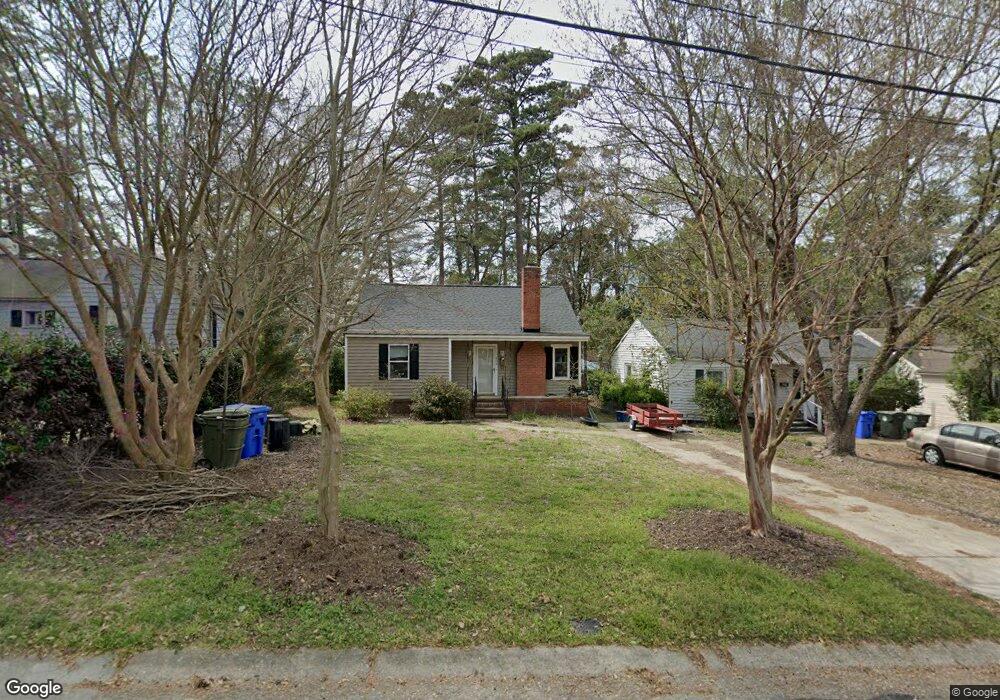
603 Pilot Ave Fayetteville, NC 28303
Terry Sanford NeighborhoodEstimated Value: $132,000 - $173,226
3
Beds
1
Bath
1,023
Sq Ft
$149/Sq Ft
Est. Value
About This Home
This home is located at 603 Pilot Ave, Fayetteville, NC 28303 and is currently estimated at $152,557, approximately $149 per square foot. 603 Pilot Ave is a home located in Cumberland County with nearby schools including Alma O Easom Elementary, Vanstory Hills Elementary School, and R. Max Abbott Middle School.
Ownership History
Date
Name
Owned For
Owner Type
Purchase Details
Closed on
Oct 29, 2024
Sold by
Nance James Kirkman
Bought by
By His Grace Investments Llc
Current Estimated Value
Home Financials for this Owner
Home Financials are based on the most recent Mortgage that was taken out on this home.
Original Mortgage
$138,996
Outstanding Balance
$137,612
Interest Rate
6.12%
Mortgage Type
New Conventional
Estimated Equity
$14,945
Purchase Details
Closed on
Apr 4, 2018
Sold by
Nixon Lisa Ann
Bought by
Nance James Kirkman
Purchase Details
Closed on
Jun 22, 2001
Sold by
Geoly Paul T
Bought by
Kirkman Nance James
Home Financials for this Owner
Home Financials are based on the most recent Mortgage that was taken out on this home.
Original Mortgage
$83,738
Interest Rate
7.16%
Create a Home Valuation Report for This Property
The Home Valuation Report is an in-depth analysis detailing your home's value as well as a comparison with similar homes in the area
Home Values in the Area
Average Home Value in this Area
Purchase History
| Date | Buyer | Sale Price | Title Company |
|---|---|---|---|
| By His Grace Investments Llc | $133,500 | None Listed On Document | |
| Nance James Kirkman | -- | None Available | |
| Kirkman Nance James | $84,500 | -- |
Source: Public Records
Mortgage History
| Date | Status | Borrower | Loan Amount |
|---|---|---|---|
| Open | By His Grace Investments Llc | $138,996 | |
| Previous Owner | Kirkman Nance James | $83,738 |
Source: Public Records
Tax History Compared to Growth
Tax History
| Year | Tax Paid | Tax Assessment Tax Assessment Total Assessment is a certain percentage of the fair market value that is determined by local assessors to be the total taxable value of land and additions on the property. | Land | Improvement |
|---|---|---|---|---|
| 2024 | $2,099 | $92,985 | $41,250 | $51,735 |
| 2023 | $2,099 | $92,985 | $41,250 | $51,735 |
| 2022 | $1,870 | $92,985 | $41,250 | $51,735 |
| 2021 | $1,870 | $92,985 | $41,250 | $51,735 |
| 2019 | $1,835 | $116,800 | $41,250 | $75,550 |
| 2018 | $1,835 | $116,800 | $41,250 | $75,550 |
| 2017 | $1,732 | $116,800 | $41,250 | $75,550 |
| 2016 | $1,476 | $108,000 | $41,250 | $66,750 |
| 2015 | $1,461 | $108,000 | $41,250 | $66,750 |
| 2014 | $1,454 | $108,000 | $41,250 | $66,750 |
Source: Public Records
Map
Nearby Homes