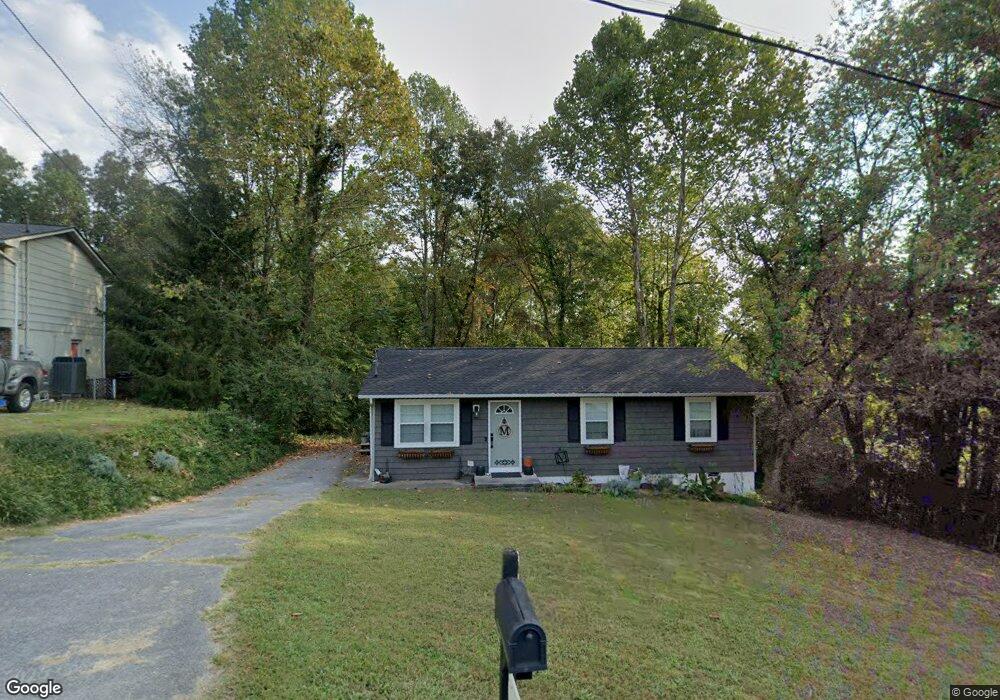
603 Red Bud Ln Oliver Springs, TN 37840
Estimated Value: $187,000 - $219,760
--
Bed
1
Bath
1,000
Sq Ft
$205/Sq Ft
Est. Value
About This Home
This home is located at 603 Red Bud Ln, Oliver Springs, TN 37840 and is currently estimated at $204,690, approximately $204 per square foot. 603 Red Bud Ln is a home located in Anderson County with nearby schools including Norwood Elementary School and Norwood Middle School.
Ownership History
Date
Name
Owned For
Owner Type
Purchase Details
Closed on
Jun 14, 2006
Sold by
Hayes Harold R
Bought by
Monger Kathy L
Current Estimated Value
Home Financials for this Owner
Home Financials are based on the most recent Mortgage that was taken out on this home.
Original Mortgage
$54,300
Outstanding Balance
$32,913
Interest Rate
7.13%
Estimated Equity
$171,777
Purchase Details
Closed on
Aug 26, 2003
Sold by
Chamblee Christopher M and Chamblee A
Bought by
Hayes Harold R
Home Financials for this Owner
Home Financials are based on the most recent Mortgage that was taken out on this home.
Original Mortgage
$50,400
Interest Rate
5.94%
Purchase Details
Closed on
Oct 2, 2000
Sold by
Cross Clarence E
Bought by
Chamblee Christopher M
Purchase Details
Closed on
Jul 5, 1994
Sold by
Fellers John
Bought by
Heydel Russell
Purchase Details
Closed on
Jan 1, 1987
Bought by
Cross Clarence E and Cross Wife Regina K
Create a Home Valuation Report for This Property
The Home Valuation Report is an in-depth analysis detailing your home's value as well as a comparison with similar homes in the area
Home Values in the Area
Average Home Value in this Area
Purchase History
| Date | Buyer | Sale Price | Title Company |
|---|---|---|---|
| Monger Kathy L | $74,300 | -- | |
| Hayes Harold R | $63,000 | -- | |
| Chamblee Christopher M | $52,500 | -- | |
| Heydel Russell | -- | -- | |
| Cross Clarence E | $29,300 | -- |
Source: Public Records
Mortgage History
| Date | Status | Borrower | Loan Amount |
|---|---|---|---|
| Open | Cross Clarence E | $54,300 | |
| Closed | Cross Clarence E | $20,000 | |
| Previous Owner | Cross Clarence E | $50,400 |
Source: Public Records
Tax History Compared to Growth
Tax History
| Year | Tax Paid | Tax Assessment Tax Assessment Total Assessment is a certain percentage of the fair market value that is determined by local assessors to be the total taxable value of land and additions on the property. | Land | Improvement |
|---|---|---|---|---|
| 2024 | $587 | $22,325 | $4,750 | $17,575 |
| 2023 | $587 | $22,325 | $0 | $0 |
| 2022 | $841 | $22,325 | $4,750 | $17,575 |
| 2021 | $841 | $22,325 | $4,750 | $17,575 |
| 2020 | $696 | $22,325 | $4,750 | $17,575 |
| 2019 | $798 | $18,975 | $4,750 | $14,225 |
| 2018 | $695 | $16,925 | $4,750 | $12,175 |
| 2017 | $695 | $16,925 | $4,750 | $12,175 |
| 2016 | $695 | $16,925 | $4,750 | $12,175 |
| 2015 | -- | $16,925 | $4,750 | $12,175 |
| 2014 | -- | $16,925 | $4,750 | $12,175 |
| 2013 | -- | $16,900 | $0 | $0 |
Source: Public Records
Map
Nearby Homes
- 610 Red Bud Ln
- 613 Red Bud Ln
- 434 Oak Cir
- 119 Aspen Ln
- 118 Green Acres St Unit 118
- 212 Crystal Ln
- 421 Sunflower Ln
- 407 Sunflower Ln Unit 407
- 120 Dale Ave
- 110 Pine Ln
- 428 Browder Cir
- 158 Wellington Cir
- 143 Wellington Cir
- 845 W Outer Dr
- 299 Haney Hollow Rd
- 167 Warrior Cir
- 306 E Tri County Blvd
- 617 W Outer Dr
- 107 Jay Ln
- 115 Morgan Rd
- 704 Sleepy Hollow Rd
- 605 Red Bud Ln
- 606 Red Bud Ln
- 640 Sleepy Hollow Rd
- 607 Red Bud Ln
- 609 Red Bud Ln
- 636 Sleepy Hollow Rd
- 708 Sleepy Hollow Rd
- 641 Sleepy Hollow Rd
- 608 Red Bud Ln
- 501 Cedar Ln
- 504 Cedar Ln
- 611 Red Bud Ln
- 632 Sleepy Hollow Rd
- 637 Sleepy Hollow Rd
- 712 Sleepy Hollow Rd
- 711 Sleepy Hollow Rd
- 503 Cedar Ln
- 633 Sleepy Hollow Rd
- 506 Cedar Ln