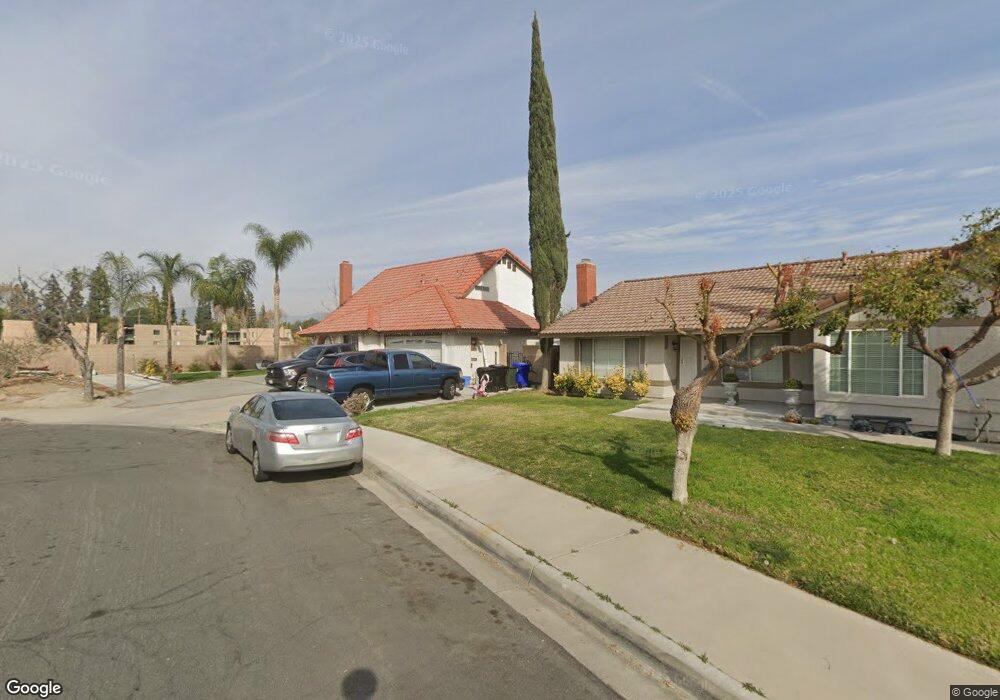
603 S Millard Ave Rialto, CA 92376
Estimated Value: $598,000 - $639,000
4
Beds
3
Baths
1,656
Sq Ft
$375/Sq Ft
Est. Value
About This Home
This home is located at 603 S Millard Ave, Rialto, CA 92376 and is currently estimated at $621,197, approximately $375 per square foot. 603 S Millard Ave is a home located in San Bernardino County with nearby schools including Sam V. Curtis Elementary School, Rialto Middle School, and Rialto High School.
Ownership History
Date
Name
Owned For
Owner Type
Purchase Details
Closed on
May 22, 2019
Sold by
Padilla Martha G
Bought by
Madrigal J Jesus Silva
Current Estimated Value
Purchase Details
Closed on
May 21, 2019
Sold by
Madrigal J Jesus Silva
Bought by
Silva Maria G and Madrigal Juan Silva
Purchase Details
Closed on
Mar 29, 2010
Sold by
Harlan Stacey and Christian Sue Ellen
Bought by
Madrigal J Jesus Silva
Home Financials for this Owner
Home Financials are based on the most recent Mortgage that was taken out on this home.
Original Mortgage
$162,011
Interest Rate
5.25%
Mortgage Type
FHA
Purchase Details
Closed on
Sep 23, 2002
Sold by
Harlan Stacey
Bought by
Harlan Stacey and Christian Sue Ellen
Purchase Details
Closed on
Jun 18, 1999
Sold by
Harlan Sue Christion
Bought by
Harlan Stacey
Home Financials for this Owner
Home Financials are based on the most recent Mortgage that was taken out on this home.
Original Mortgage
$73,211
Interest Rate
7.2%
Mortgage Type
FHA
Create a Home Valuation Report for This Property
The Home Valuation Report is an in-depth analysis detailing your home's value as well as a comparison with similar homes in the area
Home Values in the Area
Average Home Value in this Area
Purchase History
| Date | Buyer | Sale Price | Title Company |
|---|---|---|---|
| Madrigal J Jesus Silva | -- | None Available | |
| Silva Maria G | -- | None Available | |
| Madrigal J Jesus Silva | $165,000 | Ticor Title Company | |
| Harlan Stacey | -- | -- | |
| Harlan Stacey | -- | Fidelity National Title |
Source: Public Records
Mortgage History
| Date | Status | Borrower | Loan Amount |
|---|---|---|---|
| Previous Owner | Madrigal J Jesus Silva | $162,011 | |
| Previous Owner | Harlan Stacey | $73,211 |
Source: Public Records
Tax History Compared to Growth
Tax History
| Year | Tax Paid | Tax Assessment Tax Assessment Total Assessment is a certain percentage of the fair market value that is determined by local assessors to be the total taxable value of land and additions on the property. | Land | Improvement |
|---|---|---|---|---|
| 2025 | $5,398 | $404,650 | $120,302 | $284,348 |
| 2024 | $5,398 | $396,716 | $117,943 | $278,773 |
| 2023 | $5,721 | $388,937 | $115,630 | $273,307 |
| 2022 | $5,305 | $381,311 | $113,363 | $267,948 |
| 2021 | $5,274 | $373,834 | $111,140 | $262,694 |
| 2020 | $5,216 | $370,000 | $110,000 | $260,000 |
| 2019 | $2,900 | $190,934 | $47,734 | $143,200 |
| 2018 | $2,806 | $187,190 | $46,798 | $140,392 |
| 2017 | $2,788 | $183,519 | $45,880 | $137,639 |
| 2016 | $2,423 | $179,920 | $44,980 | $134,940 |
| 2015 | $2,433 | $177,217 | $44,304 | $132,913 |
| 2014 | $2,292 | $173,745 | $43,436 | $130,309 |
Source: Public Records
Map
Nearby Homes
- 405 W Merrill Ave
- 867 S Breden Ln
- 225 W Alru St
- 350 S Willow Ave Unit 115
- 350 S Willow Ave Unit 134
- 350 S Willow Ave Unit 106
- 350 S Willow Ave Unit 74
- 350 S Willow Ave Unit 63
- 161 W Wilson St
- 214 Bonita Ln
- 610 S Olive Ave
- 520 W Randall Ave
- 827 S Riverside Ave
- 687 S Fillmore Ave
- 646 S Fillmore Ave
- 692 S Brampton Ave
- 687 S Mandarin Ln
- 276 E Merrill Ave
- 629 S Sage Ave
- 352 Alice Ave
- 615 S Millard Ave
- 602 S Clifford Ave
- 608 S Clifford Ave
- 627 S Millard Ave
- 604 S Millard Ave
- 616 S Millard Ave
- 620 S Clifford Ave
- 628 S Millard Ave
- 384 W Orchard St
- 603 S Clifford Ave
- 548 S Willow Ave
- 333 W Orchard St
- 333 W 0rchard
- 607 S Clifford Ave
- 374 W Orchard St
- 353 W Orchard St
- 554 S Willow Ave
- 619 S Clifford Ave
- 323 W Orchard St
- 363 W Orchard St