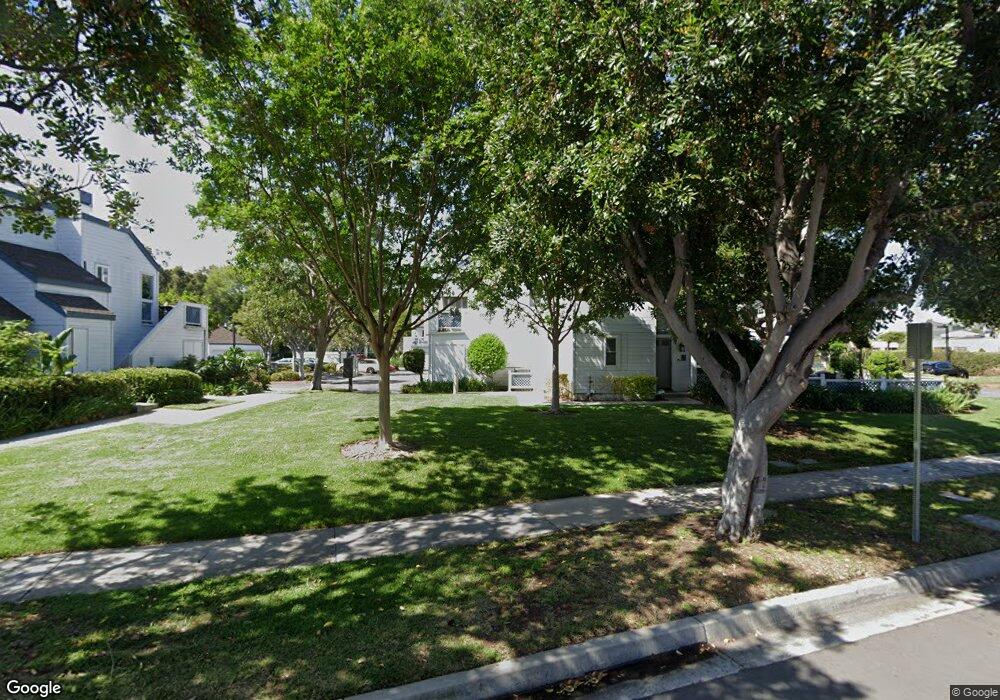
603 Springbrook N Unit 58 Irvine, CA 92614
Woodbridge NeighborhoodEstimated Value: $748,549 - $915,000
2
Beds
2
Baths
1,171
Sq Ft
$739/Sq Ft
Est. Value
About This Home
This home is located at 603 Springbrook N Unit 58, Irvine, CA 92614 and is currently estimated at $865,637, approximately $739 per square foot. 603 Springbrook N Unit 58 is a home located in Orange County with nearby schools including Springbrook Elementary School, South Lake Middle School, and Woodbridge High School.
Ownership History
Date
Name
Owned For
Owner Type
Purchase Details
Closed on
Jun 24, 2010
Sold by
Yap Calvin Chian Sin
Bought by
Yap Eileen W L
Current Estimated Value
Purchase Details
Closed on
Jun 22, 2010
Sold by
Rodriguez Max E and Rodriguez Seaby Duff
Bought by
Yap Eileen W L
Purchase Details
Closed on
Jul 6, 2006
Sold by
Foresman Guy S and Foresman Deborah R
Bought by
Rodriguez Max E and Rodriguez Seaby Duff
Home Financials for this Owner
Home Financials are based on the most recent Mortgage that was taken out on this home.
Original Mortgage
$416,000
Interest Rate
6.76%
Mortgage Type
Purchase Money Mortgage
Purchase Details
Closed on
May 21, 2005
Sold by
Lyddon Deborah R
Bought by
Foresman Guy S and Foresman Deborah R
Create a Home Valuation Report for This Property
The Home Valuation Report is an in-depth analysis detailing your home's value as well as a comparison with similar homes in the area
Home Values in the Area
Average Home Value in this Area
Purchase History
| Date | Buyer | Sale Price | Title Company |
|---|---|---|---|
| Yap Eileen W L | -- | Ticor Title Company | |
| Yap Eileen W L | $365,000 | Ticor Title Company | |
| Rodriguez Max E | $520,000 | Equity Title Company | |
| Foresman Guy S | -- | -- |
Source: Public Records
Mortgage History
| Date | Status | Borrower | Loan Amount |
|---|---|---|---|
| Previous Owner | Rodriguez Max E | $416,000 |
Source: Public Records
Tax History
| Year | Tax Paid | Tax Assessment Tax Assessment Total Assessment is a certain percentage of the fair market value that is determined by local assessors to be the total taxable value of land and additions on the property. | Land | Improvement |
|---|---|---|---|---|
| 2025 | $5,031 | $467,625 | $363,186 | $104,439 |
| 2024 | $5,031 | $458,456 | $356,064 | $102,392 |
| 2023 | $4,901 | $449,467 | $349,082 | $100,385 |
| 2022 | $4,805 | $440,654 | $342,237 | $98,417 |
| 2021 | $4,694 | $432,014 | $335,526 | $96,488 |
| 2020 | $4,668 | $427,585 | $332,086 | $95,499 |
| 2019 | $4,565 | $419,201 | $325,574 | $93,627 |
| 2018 | $4,484 | $410,982 | $319,190 | $91,792 |
| 2017 | $4,392 | $402,924 | $312,931 | $89,993 |
| 2016 | $4,201 | $395,024 | $306,795 | $88,229 |
| 2015 | $4,139 | $389,091 | $302,187 | $86,904 |
| 2014 | $4,060 | $381,470 | $296,268 | $85,202 |
Source: Public Records
Map
Nearby Homes
- 605 Springbrook N Unit 59
- 603 Springbrook N
- 607 Springbrook N Unit 60
- 607 Springbrook N
- 611 Springbrook N Unit 55
- 410 Fallingstar Unit 35
- 410 Fallingstar
- 611 Springbrook N
- 609 Springbrook N Unit 56
- 601 Springbrook N Unit 57
- 621 Springbrook N Unit 54
- 613 Springbrook N Unit 52
- 613 Springbrook N
- 615 Springbrook N Unit 51
- 649 Springbrook N
- 649 Springbrook N Unit 23
- 623 Springbrook N Unit 53
- 623 Springbrook N
- 651 Springbrook N
- 651 Springbrook N Unit 24
Your Personal Tour Guide
Ask me questions while you tour the home.