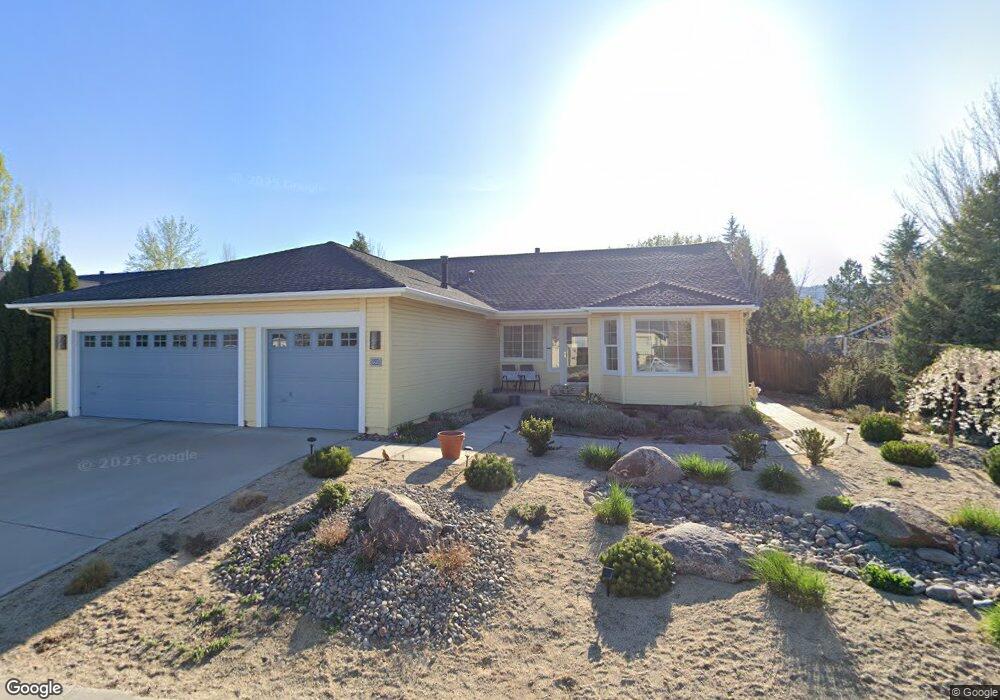
603 Sugar Tree Ct Reno, NV 89511
Summit Sierra NeighborhoodEstimated Value: $853,291 - $1,017,000
3
Beds
3
Baths
2,202
Sq Ft
$413/Sq Ft
Est. Value
About This Home
This home is located at 603 Sugar Tree Ct, Reno, NV 89511 and is currently estimated at $908,823, approximately $412 per square foot. 603 Sugar Tree Ct is a home located in Washoe County with nearby schools including Elizabeth Lenz Elementary School, Marce Herz Middle School, and Galena High School.
Ownership History
Date
Name
Owned For
Owner Type
Purchase Details
Closed on
May 23, 2005
Sold by
Arnone John A and Arnone Lynn M
Bought by
Arnone John A and Arnone Lynn M
Current Estimated Value
Purchase Details
Closed on
Jun 24, 2003
Sold by
Arnone John A and Arnone Lynn M
Bought by
Arnone John A and Arnone Lynn M
Home Financials for this Owner
Home Financials are based on the most recent Mortgage that was taken out on this home.
Original Mortgage
$156,000
Interest Rate
5.37%
Mortgage Type
Unknown
Purchase Details
Closed on
May 4, 2000
Sold by
Arnone John A and Arnone Lynn M
Bought by
Arnone John A and Arnone Lynn M
Purchase Details
Closed on
Feb 24, 2000
Sold by
Arnone John A and Arnone Lynn M
Bought by
John A Arnone Iii & Lynn Arnone Joint Tr
Purchase Details
Closed on
Apr 22, 1999
Sold by
Mountain View Development Inc
Bought by
Arnone John A and Arnone Lynn M
Home Financials for this Owner
Home Financials are based on the most recent Mortgage that was taken out on this home.
Original Mortgage
$165,550
Interest Rate
7.1%
Create a Home Valuation Report for This Property
The Home Valuation Report is an in-depth analysis detailing your home's value as well as a comparison with similar homes in the area
Home Values in the Area
Average Home Value in this Area
Purchase History
| Date | Buyer | Sale Price | Title Company |
|---|---|---|---|
| Arnone John A | -- | -- | |
| Arnone John A | -- | First American Title | |
| Arnone John A | -- | -- | |
| John A Arnone Iii & Lynn Arnone Joint Tr | -- | -- | |
| Arnone John A | $207,000 | First American Title Co |
Source: Public Records
Mortgage History
| Date | Status | Borrower | Loan Amount |
|---|---|---|---|
| Previous Owner | Arnone John A | $156,000 | |
| Previous Owner | Arnone John A | $165,550 |
Source: Public Records
Tax History Compared to Growth
Tax History
| Year | Tax Paid | Tax Assessment Tax Assessment Total Assessment is a certain percentage of the fair market value that is determined by local assessors to be the total taxable value of land and additions on the property. | Land | Improvement |
|---|---|---|---|---|
| 2025 | $3,479 | $159,664 | $65,240 | $94,424 |
| 2024 | $3,479 | $148,252 | $54,600 | $93,652 |
| 2023 | $2,530 | $147,331 | $58,415 | $88,916 |
| 2022 | $3,281 | $120,731 | $46,445 | $74,286 |
| 2021 | $3,186 | $107,413 | $33,390 | $74,023 |
| 2020 | $3,091 | $106,165 | $31,850 | $74,315 |
| 2019 | $3,001 | $103,845 | $31,185 | $72,660 |
| 2018 | $2,915 | $94,778 | $23,590 | $71,188 |
| 2017 | $2,825 | $91,754 | $20,370 | $71,384 |
| 2016 | $2,754 | $94,856 | $21,910 | $72,946 |
| 2015 | $2,748 | $91,346 | $18,480 | $72,866 |
| 2014 | $2,668 | $86,206 | $15,715 | $70,491 |
| 2013 | -- | $79,938 | $11,025 | $68,913 |
Source: Public Records
Map
Nearby Homes
- 15504 Quicksilver Dr
- 15524 Quicksilver Dr
- 1890 Tess Way
- 17000 Wedge Pkwy Unit 422
- 17000 Wedge Pkwy Unit 2624
- 17020 Castle Pine Dr
- 13315 Arrowcreek Pkwy
- 14310 Mount Snow Dr
- 1210 Springer Ct
- 13335 Satinspar Dr
- 13000 Silver Wolf Rd
- 12900 Silver Wolf Rd
- 13005 Silver Wolf Rd
- 3705 Boulder Patch
- 12875 Silver Wolf Rd
- 14013 Dancing Flame Ct
- 12775 Silver Wolf Rd Unit 12A
- 14033 Crested Moss Ct
- 1465 Taos Ln
- 12880 Welcome Way
- 601 Sugar Tree Ct
- 605 Sugar Tree Ct
- 15509 Quicksilver Dr
- 607 Sugar Tree Ct
- 600 Sugar Tree Ct
- 15511 Quicksilver Dr
- 602 Sugar Tree Ct
- 604 Sugar Tree Ct
- 606 Sugar Tree Ct
- 609 Sugar Tree Ct
- 15502 Quicksilver Dr Unit 96
- 15500 Quicksilver Dr
- 15503 Quicksilver Dr
- 15506 Quicksilver Dr
- 610 Sugar Tree Ct
- 502 Silversmith Place
- 500 Silversmith Place
- 504 Silversmith Place
- 15508 Quicksilver Dr
- 614 Sugar Tree Ct