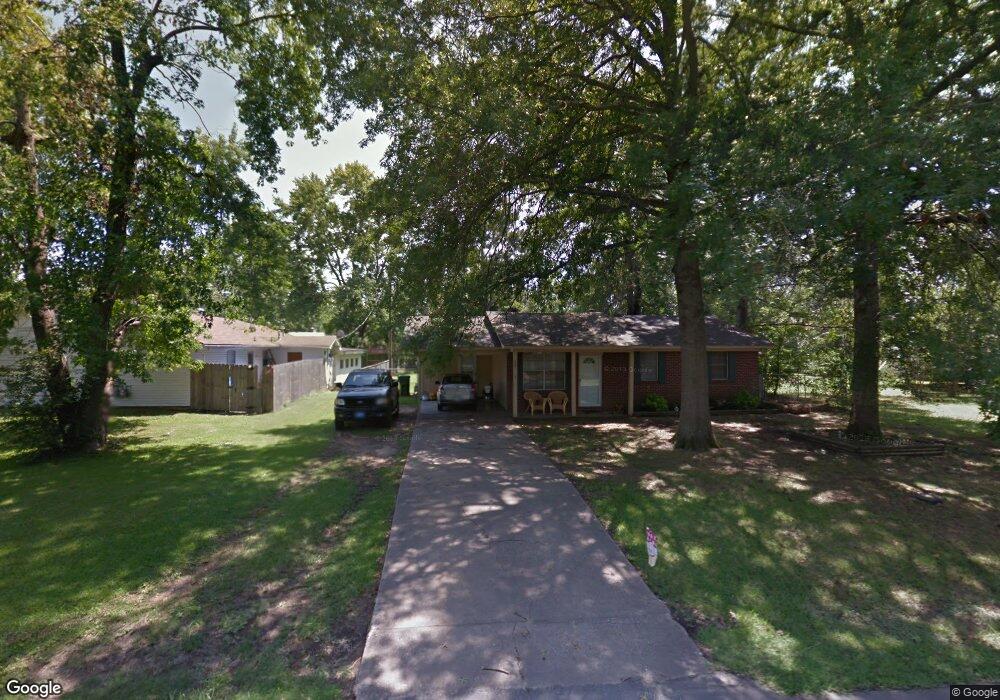
603 SW 2nd St Bryant, AR 72022
Estimated Value: $159,000 - $180,000
3
Beds
2
Baths
1,242
Sq Ft
$137/Sq Ft
Est. Value
About This Home
This home is located at 603 SW 2nd St, Bryant, AR 72022 and is currently estimated at $170,599, approximately $137 per square foot. 603 SW 2nd St is a home located in Saline County with nearby schools including Hill Farm Elementary School, Bryant Middle School, and Bethel Middle School.
Ownership History
Date
Name
Owned For
Owner Type
Purchase Details
Closed on
Apr 13, 2010
Bought by
Johnson
Current Estimated Value
Purchase Details
Closed on
Apr 8, 2010
Bought by
Johnson
Purchase Details
Closed on
Dec 22, 2005
Sold by
Carpenter Brian K and Carpenter Cheryn A
Bought by
Piker Jerrod R and Piker Anna R
Home Financials for this Owner
Home Financials are based on the most recent Mortgage that was taken out on this home.
Original Mortgage
$78,500
Interest Rate
6.3%
Mortgage Type
New Conventional
Purchase Details
Closed on
Nov 30, 2005
Sold by
Carpenter Brian K and Carpenter Cheryn A
Bought by
Piker Jerrod R and Piker Anna R
Home Financials for this Owner
Home Financials are based on the most recent Mortgage that was taken out on this home.
Original Mortgage
$78,500
Interest Rate
6.3%
Mortgage Type
New Conventional
Purchase Details
Closed on
Dec 6, 2002
Bought by
Carpenter
Purchase Details
Closed on
Mar 1, 1992
Bought by
Faulkner
Create a Home Valuation Report for This Property
The Home Valuation Report is an in-depth analysis detailing your home's value as well as a comparison with similar homes in the area
Home Values in the Area
Average Home Value in this Area
Purchase History
| Date | Buyer | Sale Price | Title Company |
|---|---|---|---|
| Johnson | $94,000 | -- | |
| Johnson | $94,000 | -- | |
| Piker Jerrod R | $75,000 | -- | |
| Piker Jerrod R | $75,000 | -- | |
| Carpenter | $65,000 | -- | |
| Faulkner | $48,000 | -- |
Source: Public Records
Mortgage History
| Date | Status | Borrower | Loan Amount |
|---|---|---|---|
| Previous Owner | Piker Jerrod R | $78,500 | |
| Previous Owner | Piker Jerrod R | $78,500 |
Source: Public Records
Tax History Compared to Growth
Tax History
| Year | Tax Paid | Tax Assessment Tax Assessment Total Assessment is a certain percentage of the fair market value that is determined by local assessors to be the total taxable value of land and additions on the property. | Land | Improvement |
|---|---|---|---|---|
| 2025 | $1,086 | $24,300 | $5,440 | $18,860 |
| 2024 | $991 | $24,300 | $5,440 | $18,860 |
| 2023 | $614 | $24,300 | $5,440 | $18,860 |
| 2022 | $593 | $24,300 | $5,440 | $18,860 |
| 2021 | $550 | $17,660 | $3,400 | $14,260 |
| 2020 | $518 | $17,660 | $3,400 | $14,260 |
| 2019 | $518 | $17,660 | $3,400 | $14,260 |
| 2018 | $504 | $17,660 | $3,400 | $14,260 |
| 2017 | $465 | $17,660 | $3,400 | $14,260 |
| 2016 | $723 | $14,820 | $3,400 | $11,420 |
| 2015 | $373 | $14,820 | $3,400 | $11,420 |
| 2014 | $373 | $14,820 | $3,400 | $11,420 |
Source: Public Records
Map
Nearby Homes
- 109 S Vine St
- 51 Wagner St
- 330 N Elm St
- 208 Summerfield Dr
- 1107 Fox Chase Dr
- 913 Fawn Creek Dr
- 1607 Boone Rd
- 5 Arcadia Cir
- 86 Bame Cir Unit 1
- 600 Bristol Dr
- 1602 Rodeo Dr
- 1311 Oscar Dr
- 3.39 Acres N Reynolds Rd
- 10 Acres Woodland Park Rd
- Lot 18 Ethel Dr
- 1315 Helen Ct
- 1810 Bishop Rd
- 511 Holly Lynn Dr
- 2025 N Reynolds Rd
- lot 7 Kindness Ct