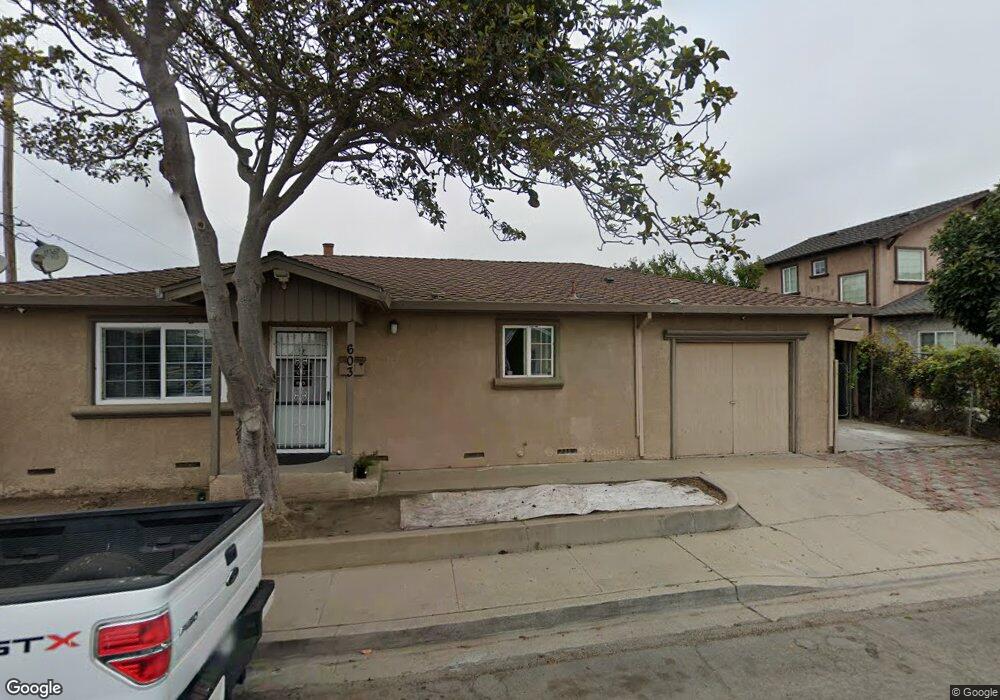
603 Terrace St Salinas, CA 93905
East Salinas NeighborhoodEstimated Value: $533,000 - $651,000
2
Beds
1
Bath
832
Sq Ft
$693/Sq Ft
Est. Value
About This Home
This home is located at 603 Terrace St, Salinas, CA 93905 and is currently estimated at $576,437, approximately $692 per square foot. 603 Terrace St is a home located in Monterey County with nearby schools including El Gabilan Elementary School, Natividad Elementary School, and Loma Vista Elementary School.
Ownership History
Date
Name
Owned For
Owner Type
Purchase Details
Closed on
Jan 10, 2014
Sold by
Rodriguez Elias F Lopez
Bought by
Rodriguez Elias F Lopez and Lopez Karina
Current Estimated Value
Home Financials for this Owner
Home Financials are based on the most recent Mortgage that was taken out on this home.
Original Mortgage
$142,857
Outstanding Balance
$107,559
Interest Rate
4.32%
Mortgage Type
New Conventional
Estimated Equity
$468,878
Purchase Details
Closed on
Dec 26, 2013
Sold by
Lopez Karina
Bought by
Lopez Rodriguez Elias F
Home Financials for this Owner
Home Financials are based on the most recent Mortgage that was taken out on this home.
Original Mortgage
$142,857
Outstanding Balance
$107,559
Interest Rate
4.32%
Mortgage Type
New Conventional
Estimated Equity
$468,878
Purchase Details
Closed on
Oct 21, 2012
Sold by
Rodriguez Jose Antonio
Bought by
Rodriguez Jose Antonio and Lopez Ana E
Create a Home Valuation Report for This Property
The Home Valuation Report is an in-depth analysis detailing your home's value as well as a comparison with similar homes in the area
Home Values in the Area
Average Home Value in this Area
Purchase History
| Date | Buyer | Sale Price | Title Company |
|---|---|---|---|
| Rodriguez Elias F Lopez | -- | None Available | |
| Lopez Rodriguez Elias F | -- | Old Republic Title Company | |
| Rodriguez Elias F | $140,000 | Old Republic Title Company | |
| Rodriguez Jose Antonio | -- | None Available |
Source: Public Records
Mortgage History
| Date | Status | Borrower | Loan Amount |
|---|---|---|---|
| Open | Lopez Rodriguez Elias F | $142,857 |
Source: Public Records
Tax History Compared to Growth
Tax History
| Year | Tax Paid | Tax Assessment Tax Assessment Total Assessment is a certain percentage of the fair market value that is determined by local assessors to be the total taxable value of land and additions on the property. | Land | Improvement |
|---|---|---|---|---|
| 2025 | $1,608 | $143,657 | $78,468 | $65,189 |
| 2024 | $1,608 | $140,841 | $76,930 | $63,911 |
| 2023 | $1,552 | $138,080 | $75,422 | $62,658 |
| 2022 | $1,492 | $135,374 | $73,944 | $61,430 |
| 2021 | $1,432 | $132,721 | $72,495 | $60,226 |
| 2020 | $1,392 | $131,361 | $71,752 | $59,609 |
| 2019 | $1,379 | $128,787 | $70,346 | $58,441 |
| 2018 | $1,358 | $126,263 | $68,967 | $57,296 |
| 2017 | $1,357 | $123,788 | $67,615 | $56,173 |
| 2016 | $1,356 | $121,362 | $66,290 | $55,072 |
| 2015 | $1,366 | $119,540 | $65,295 | $54,245 |
| 2014 | $1,302 | $164,426 | $72,973 | $91,453 |
Source: Public Records
Map
Nearby Homes
- 487 E Market St
- 150 Kern St Unit 39
- 150 Kern St Unit 40
- 150 Kern St Unit 92
- 166 Kern St Unit 19
- 166 Kern St Unit 26
- 75 S Madeira Ave
- 840 N Madeira Ave
- 11 Hill Cir
- 916 Acosta Plaza Unit 23
- 916 Acosta Plaza Unit 15
- 914 Acosta Plaza Unit 94
- 914 Acosta Plaza Unit 111
- 914 Acosta Plaza Unit 91
- 17 Williams Rd
- 912 Acosta Plaza Unit 11
- 709 Gee St
- 453 Carol Dr
- 15 Saint Francis Way
- 1 Santa Lucia Ave