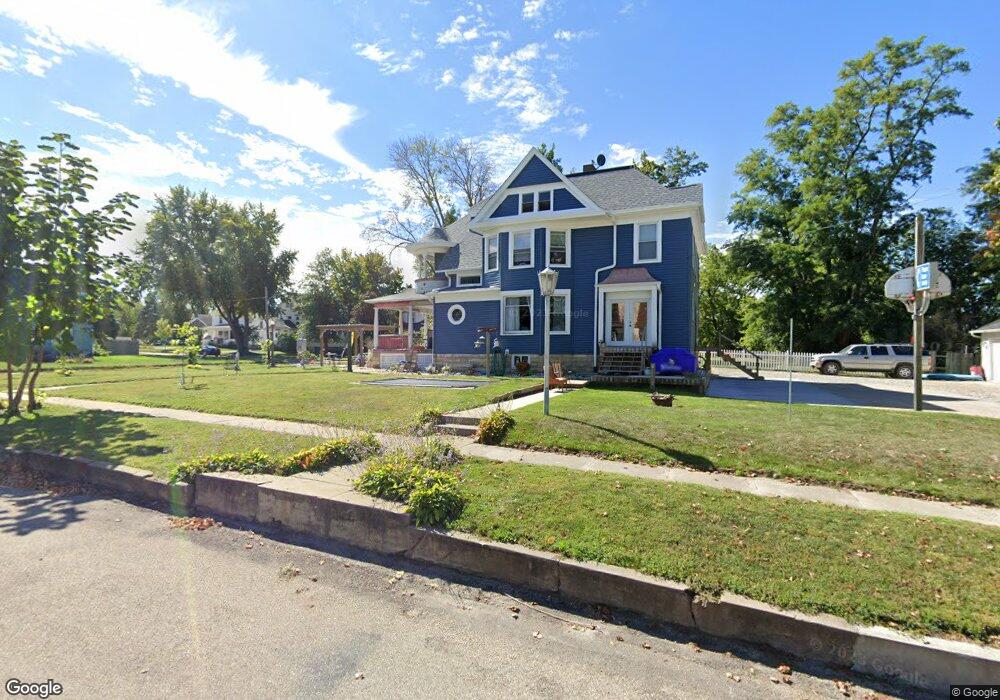
603 W 5th St Vinton, IA 52349
Estimated Value: $220,000 - $289,000
4
Beds
3
Baths
2,616
Sq Ft
$94/Sq Ft
Est. Value
About This Home
This home is located at 603 W 5th St, Vinton, IA 52349 and is currently estimated at $245,454, approximately $93 per square foot. 603 W 5th St is a home located in Benton County with nearby schools including Tilford Elementary School, Shellsburg Elementary School, and Vinton-Shellsburg Middle School.
Ownership History
Date
Name
Owned For
Owner Type
Purchase Details
Closed on
Feb 1, 2013
Sold by
Linn Area Credit Union
Bought by
Elwick Andrew M and Elwick Carol J
Current Estimated Value
Purchase Details
Closed on
Jan 11, 2008
Sold by
Hill Matthew S and Hill Jennifer M
Bought by
Richter Scott and Richter Heather N
Home Financials for this Owner
Home Financials are based on the most recent Mortgage that was taken out on this home.
Original Mortgage
$102,400
Interest Rate
7.5%
Mortgage Type
Adjustable Rate Mortgage/ARM
Create a Home Valuation Report for This Property
The Home Valuation Report is an in-depth analysis detailing your home's value as well as a comparison with similar homes in the area
Home Values in the Area
Average Home Value in this Area
Purchase History
| Date | Buyer | Sale Price | Title Company |
|---|---|---|---|
| Elwick Andrew M | $82,000 | None Available | |
| Richter Scott | $125,000 | None Available |
Source: Public Records
Mortgage History
| Date | Status | Borrower | Loan Amount |
|---|---|---|---|
| Previous Owner | Richter Scott | $102,400 |
Source: Public Records
Tax History Compared to Growth
Tax History
| Year | Tax Paid | Tax Assessment Tax Assessment Total Assessment is a certain percentage of the fair market value that is determined by local assessors to be the total taxable value of land and additions on the property. | Land | Improvement |
|---|---|---|---|---|
| 2025 | $3,582 | $216,200 | $20,200 | $196,000 |
| 2024 | $3,582 | $201,400 | $19,400 | $182,000 |
| 2023 | $3,162 | $181,200 | $19,400 | $161,800 |
| 2022 | $3,244 | $155,800 | $15,500 | $140,300 |
| 2021 | $3,244 | $155,800 | $15,500 | $140,300 |
| 2020 | $2,938 | $144,600 | $18,900 | $125,700 |
| 2019 | $3,146 | $144,600 | $18,900 | $125,700 |
| 2018 | $3,052 | $152,000 | $18,400 | $133,600 |
| 2017 | $3,052 | $152,000 | $18,400 | $133,600 |
| 2016 | $2,878 | $142,100 | $17,200 | $124,900 |
| 2015 | $2,878 | $142,100 | $17,200 | $124,900 |
| 2014 | $2,834 | $117,000 | $0 | $0 |
Source: Public Records
Map
Nearby Homes