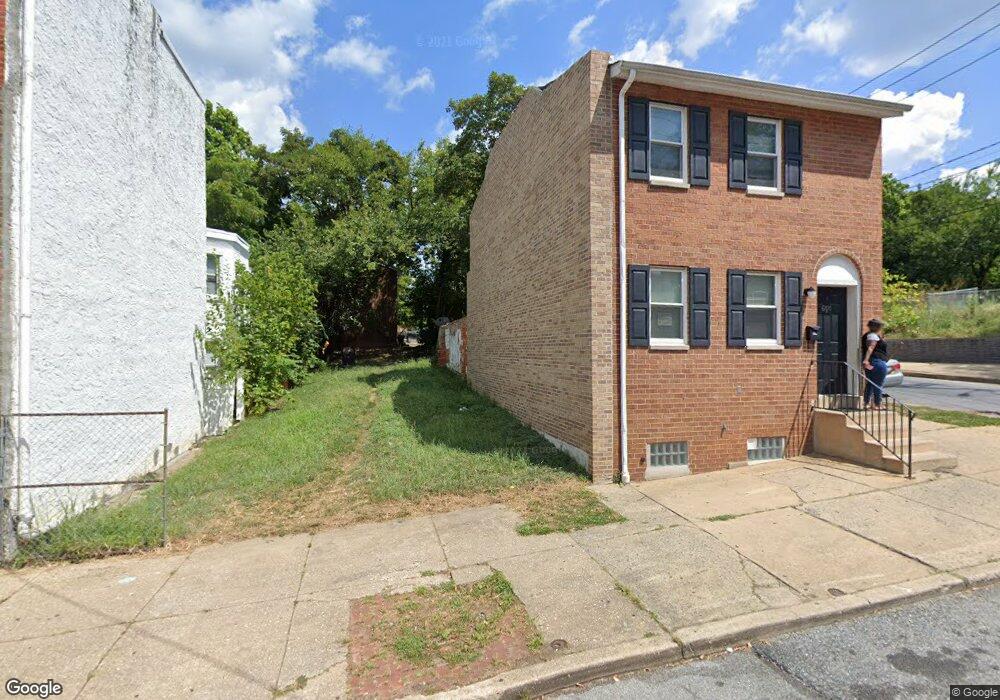
603 W 5th St Wilmington, DE 19801
Downtown Wilmington NeighborhoodEstimated Value: $280,525 - $495,000
6
Beds
1
Bath
2,625
Sq Ft
$131/Sq Ft
Est. Value
About This Home
This home is located at 603 W 5th St, Wilmington, DE 19801 and is currently estimated at $343,131, approximately $130 per square foot. 603 W 5th St is a home located in New Castle County with nearby schools including The Bancroft School, The Bayard School, and Newark High School.
Ownership History
Date
Name
Owned For
Owner Type
Purchase Details
Closed on
Jul 25, 2018
Sold by
City Of Wilmington
Bought by
Wilmington Neighborhood Conservancy Land
Current Estimated Value
Purchase Details
Closed on
Apr 18, 2018
Sold by
Conyers Nolton
Bought by
City Of Wilmington
Purchase Details
Closed on
Mar 24, 2005
Sold by
Citifinancial Mortgage Co Inc
Bought by
Conyers Nolton
Home Financials for this Owner
Home Financials are based on the most recent Mortgage that was taken out on this home.
Original Mortgage
$68,250
Interest Rate
5.79%
Mortgage Type
Credit Line Revolving
Purchase Details
Closed on
Feb 28, 2005
Sold by
Farmer Walter and Farmer Mary Ann
Bought by
Citifinancial Mortgage Co
Home Financials for this Owner
Home Financials are based on the most recent Mortgage that was taken out on this home.
Original Mortgage
$68,250
Interest Rate
5.79%
Mortgage Type
Credit Line Revolving
Create a Home Valuation Report for This Property
The Home Valuation Report is an in-depth analysis detailing your home's value as well as a comparison with similar homes in the area
Home Values in the Area
Average Home Value in this Area
Purchase History
| Date | Buyer | Sale Price | Title Company |
|---|---|---|---|
| Wilmington Neighborhood Conservancy Land | -- | None Available | |
| City Of Wilmington | $12,000 | None Available | |
| Conyers Nolton | $44,900 | -- | |
| Citifinancial Mortgage Co | $86,156 | -- |
Source: Public Records
Mortgage History
| Date | Status | Borrower | Loan Amount |
|---|---|---|---|
| Previous Owner | Conyers Nolton | $68,250 |
Source: Public Records
Tax History
| Year | Tax Paid | Tax Assessment Tax Assessment Total Assessment is a certain percentage of the fair market value that is determined by local assessors to be the total taxable value of land and additions on the property. | Land | Improvement |
|---|---|---|---|---|
| 2025 | -- | $232,200 | $232,200 | -- |
| 2024 | -- | $39,600 | $3,200 | $36,400 |
| 2023 | -- | $39,600 | $3,200 | $36,400 |
| 2022 | $0 | $39,600 | $3,200 | $36,400 |
| 2021 | $790 | $39,600 | $3,200 | $36,400 |
| 2020 | $790 | $39,600 | $3,200 | $36,400 |
| 2019 | $790 | $39,600 | $3,200 | $36,400 |
| 2018 | $503 | $39,600 | $3,200 | $36,400 |
| 2017 | $1,104 | $39,600 | $3,200 | $36,400 |
| 2016 | $10,470 | $39,600 | $3,200 | $36,400 |
| 2015 | $1,720 | $39,600 | $3,200 | $36,400 |
| 2014 | $1,719 | $39,600 | $3,200 | $36,400 |
Source: Public Records
Map
Nearby Homes
Your Personal Tour Guide
Ask me questions while you tour the home.