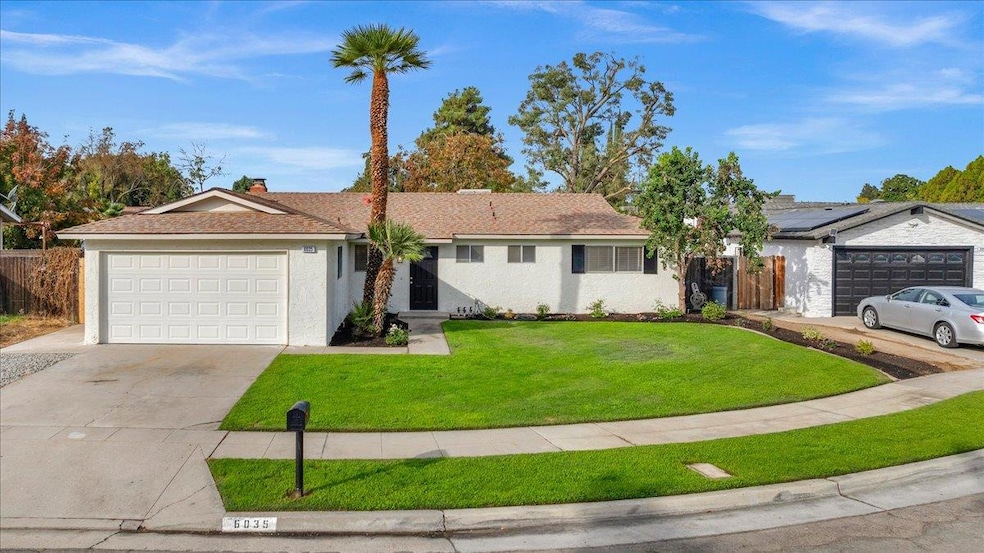

6035 N Selland Ave Fresno, CA 93711
Fig Garden Loop NeighborhoodEstimated payment $2,373/month
Highlights
- Mature Landscaping
- 1-Story Property
- Central Heating and Cooling System
- Bathtub with Shower
About This Home
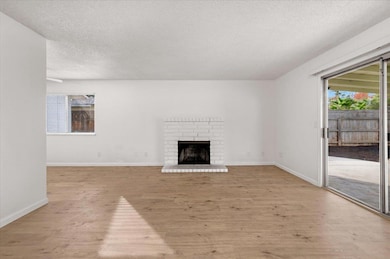
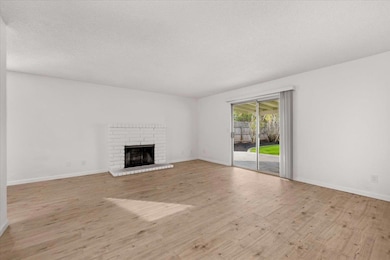
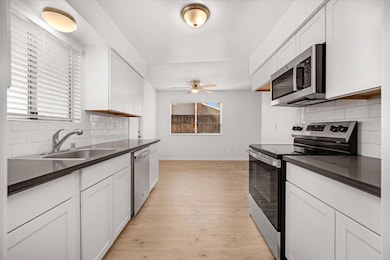
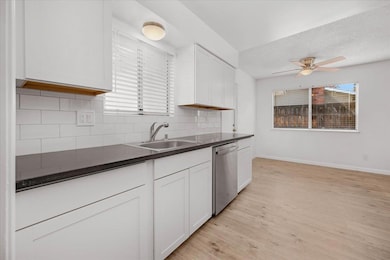
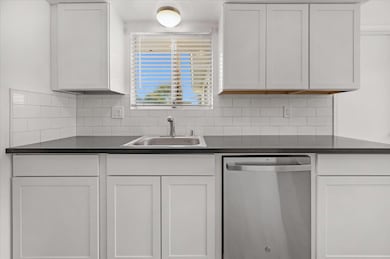
Beautifully Updated 3-Bedroom Home in NW Fresno!Nestled on a quiet cul-de-sac in the desirable Bullard High School district, this fully renovated 3 bedroom, 2 bath home offers modern comfort and style in an unbeatable location. Step inside to find new Pergo flooring throughout, fresh interior paint, and a brand new kitchen featuring updated cabinets, sleek quartz countertops, and new appliances. The inviting great room includes a cozy fireplace, perfect for relaxing evenings or gatherings with friends and family. Both bathrooms have been tastefully and completely remodeled, providing a spa-like feel.The spacious layout is ideal for everyday living and entertaining, and the large lot offers plenty of room for outdoor enjoyment, gardening, or future possibilities. Just minutes from schools, shopping, restaurants, and all the conveniences of northwest Fresno.Move-in ready and beautifully redone, this is a must-see!
Home Details
Home Type
- Single Family
Est. Annual Taxes
- $3,267
Year Built
- Built in 1976
Lot Details
- 7,800 Sq Ft Lot
- Lot Dimensions are 65x120
- Mature Landscaping
- Front Yard Sprinklers
- Property is zoned RS4
Home Design
- Concrete Foundation
- Composition Roof
- Stucco
Interior Spaces
- 1,100 Sq Ft Home
- 1-Story Property
- Fireplace Features Masonry
- Laundry in Garage
Kitchen
- Oven or Range
- Microwave
- Dishwasher
- Disposal
Bedrooms and Bathrooms
- 3 Bedrooms
- 2 Bathrooms
- Bathtub with Shower
- Separate Shower
Utilities
- Central Heating and Cooling System
Map
Home Values in the Area
Average Home Value in this Area
Tax History
| Year | Tax Paid | Tax Assessment Tax Assessment Total Assessment is a certain percentage of the fair market value that is determined by local assessors to be the total taxable value of land and additions on the property. | Land | Improvement |
|---|---|---|---|---|
| 2025 | $3,267 | $250,929 | $44,069 | $206,860 |
| 2023 | $3,082 | $241,186 | $42,358 | $198,828 |
| 2022 | $3,040 | $236,458 | $41,528 | $194,930 |
| 2021 | $2,720 | $213,100 | $68,900 | $144,200 |
| 2020 | $2,491 | $193,800 | $62,700 | $131,100 |
| 2019 | $2,339 | $185,500 | $60,000 | $125,500 |
| 2018 | $2,268 | $180,200 | $58,300 | $121,900 |
| 2017 | $2,146 | $170,000 | $55,000 | $115,000 |
| 2016 | $2,260 | $181,700 | $31,800 | $149,900 |
| 2015 | $2,144 | $172,300 | $30,200 | $142,100 |
| 2014 | $2,009 | $161,400 | $28,300 | $133,100 |
Property History
| Date | Event | Price | List to Sale | Price per Sq Ft |
|---|---|---|---|---|
| 11/15/2025 11/15/25 | For Sale | $399,000 | -- | $363 / Sq Ft |
Purchase History
| Date | Type | Sale Price | Title Company |
|---|---|---|---|
| Interfamily Deed Transfer | -- | None Available | |
| Grant Deed | $176,500 | Chicago Title Company | |
| Interfamily Deed Transfer | -- | -- | |
| Quit Claim Deed | -- | -- |
Source: Fresno MLS
MLS Number: 640013
APN: 406-363-11S
Disclaimer: Certain information contained herein is derived from information provided by parties other than Homes.com. All information provided is deemed reliable, but is not guaranteed to be accurate and should be independently verified.
![]() IDX information is provided exclusively for personal, non-commercial use, and may not be used for any purpose other than to identify prospective properties consumers may be interested in purchasing. Information is deemed reliable but not guaranteed.
IDX information is provided exclusively for personal, non-commercial use, and may not be used for any purpose other than to identify prospective properties consumers may be interested in purchasing. Information is deemed reliable but not guaranteed.
- 5683 N Rafael Ave
- 6155 N Haslam Ave
- 3386 W Stuart Ave
- 3742 W Bullard Ave
- 6107 N Tamera Ave
- 6305 N Marty Ave
- 3462 W Wrenwood Ave
- 4056 W Pear Tree Ln
- 3449 W Wrenwood Ave
- 5560 N Plum Ln
- 5455 N Marty Ave Unit 138
- 5455 N Marty Ave Unit 115
- 3236 W Browning Ave
- 3436 W Sierra Ave
- 4088 W Fig Tree Ln
- 6435 N Gentry Ave
- 3770 W Barstow Ave Unit 142
- 3700 W Barstow Ave Unit 136
- 3135 W Roberts Ave
- 5443 N Prospect Ave
- 3555 W Bullard Ave
- 5655 N Marty Ave
- 6157 N Alva Ave
- 3426 W Dovewood Ave
- 6055 N Brawley Ave
- 5610 N Gates Ave
- 5200 N Valentine Ave
- 5350 N Brawley Ave
- 5355 N Valentine Ave
- 4259 W Bullard Ave
- 5537 N Gates Ave
- 5220 N Brawley Ave
- 3515 W San Jose Ave
- 4262 W Figarden Dr
- 5451 N Gates Ave
- 5150 N Valentine Ave
- 5490 N Salinas Ave
- 5473 N Salinas Ave
- 6338 N Cecelia Ave
- 4290 W San Jose Ave
