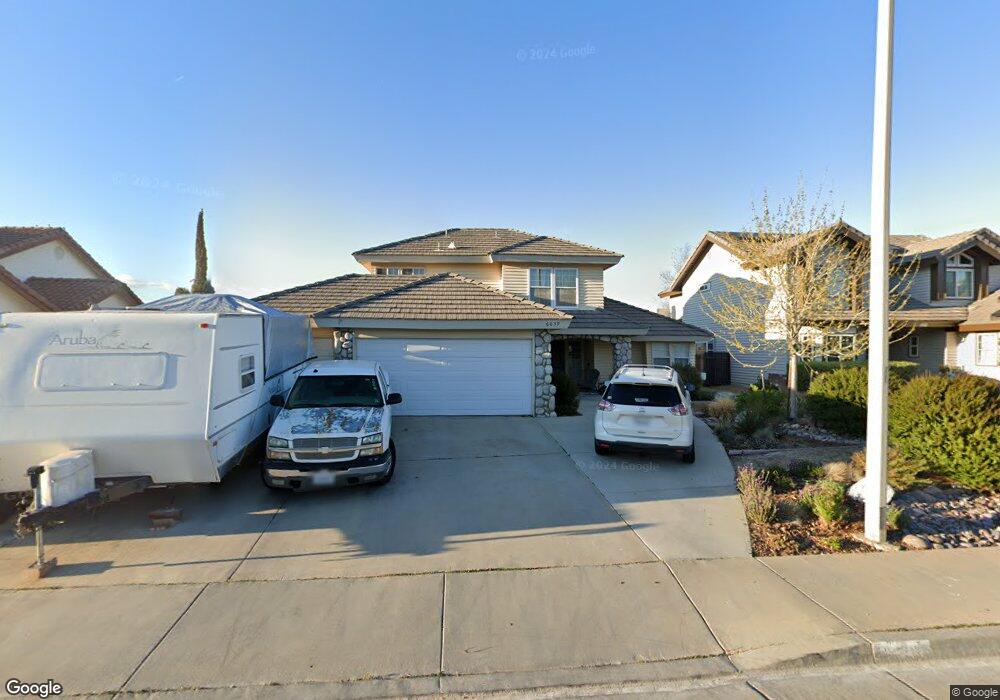
6039 Caleche Rd Lancaster, CA 93536
West Lancaster NeighborhoodEstimated Value: $533,009 - $574,000
4
Beds
3
Baths
2,144
Sq Ft
$261/Sq Ft
Est. Value
About This Home
This home is located at 6039 Caleche Rd, Lancaster, CA 93536 and is currently estimated at $560,002, approximately $261 per square foot. 6039 Caleche Rd is a home located in Los Angeles County with nearby schools including Sundown Elementary School, Joe Walker Middle School, and Quartz Hill High School.
Ownership History
Date
Name
Owned For
Owner Type
Purchase Details
Closed on
Dec 2, 2011
Sold by
Skyline Vista Equities Llc
Bought by
Blackwell Robert J and Blackwell Jeannie Kay
Current Estimated Value
Home Financials for this Owner
Home Financials are based on the most recent Mortgage that was taken out on this home.
Original Mortgage
$143,920
Outstanding Balance
$98,120
Interest Rate
3.94%
Mortgage Type
New Conventional
Estimated Equity
$461,882
Purchase Details
Closed on
Sep 30, 2011
Sold by
Fernandez Felipe
Bought by
Skyline Vista Equities Llc
Purchase Details
Closed on
Apr 20, 2006
Sold by
Boyd Terry L and Boyd Linda E
Bought by
Fernandez Felipe
Home Financials for this Owner
Home Financials are based on the most recent Mortgage that was taken out on this home.
Original Mortgage
$320,000
Interest Rate
6.87%
Mortgage Type
New Conventional
Create a Home Valuation Report for This Property
The Home Valuation Report is an in-depth analysis detailing your home's value as well as a comparison with similar homes in the area
Home Values in the Area
Average Home Value in this Area
Purchase History
| Date | Buyer | Sale Price | Title Company |
|---|---|---|---|
| Blackwell Robert J | $180,000 | Advantage Title Inc | |
| Skyline Vista Equities Llc | $132,000 | Accommodation | |
| Fernandez Felipe | $400,000 | Fidelity National Title Co |
Source: Public Records
Mortgage History
| Date | Status | Borrower | Loan Amount |
|---|---|---|---|
| Open | Blackwell Robert J | $143,920 | |
| Previous Owner | Fernandez Felipe | $320,000 |
Source: Public Records
Tax History
| Year | Tax Paid | Tax Assessment Tax Assessment Total Assessment is a certain percentage of the fair market value that is determined by local assessors to be the total taxable value of land and additions on the property. | Land | Improvement |
|---|---|---|---|---|
| 2025 | $3,489 | $225,950 | $45,211 | $180,739 |
| 2024 | $3,489 | $221,521 | $44,325 | $177,196 |
| 2023 | $3,462 | $217,178 | $43,456 | $173,722 |
| 2022 | $3,411 | $212,920 | $42,604 | $170,316 |
| 2021 | $3,353 | $208,746 | $41,769 | $166,977 |
| 2019 | $3,275 | $202,556 | $40,531 | $162,025 |
| 2018 | $3,231 | $198,586 | $39,737 | $158,849 |
| 2016 | $3,061 | $190,877 | $38,195 | $152,682 |
| 2015 | $3,029 | $188,011 | $37,622 | $150,389 |
| 2014 | $3,020 | $184,330 | $36,886 | $147,444 |
Source: Public Records
Map
Nearby Homes
- 42427 61st St W
- 42453 Surrey Ct
- 6001 Brougham St
- 5842 Corinthian Place
- 42350 Encanto Way
- 42302 58th St W
- 42519 Cinnabar Ct
- 5619 W Avenue l4
- 5711 Columbia Way Unit Spc 137
- 5711 Columbia Way Unit 137
- 5711 Columbia Way Unit Spc 80
- 5711 Columbia Way Unit 96
- 5711 Columbia Way Unit Spc 231
- 5711 Columbia Way Unit 96
- 5711 Columbia Way Unit Spc 99
- 5711 Columbia Way Unit 57
- 5517 Harmony Ln
- 42118 Tropez Dr
- 6634 Lime Rd
- 6608 Teasdale St
- 6033 Caleche Rd
- 6045 Caleche Rd
- 6025 Caleche Rd
- 42438 61st St W
- 6051 Caleche Rd
- 42443 Surrey Ct
- 6015 Caleche Rd
- 6044 Caleche Rd
- 6036 Caleche Rd
- 6040 Brougham St
- 42447 Surrey Ct
- 6036 Brougham St
- 42440 61st St W
- 6050 Caleche Rd
- 6024 Caleche Rd
- 6005 Caleche Rd
- 6014 Caleche Rd
- 42435 61st St Quartz Hill
- 42435 61st St W
- 42442 Surrey Ct