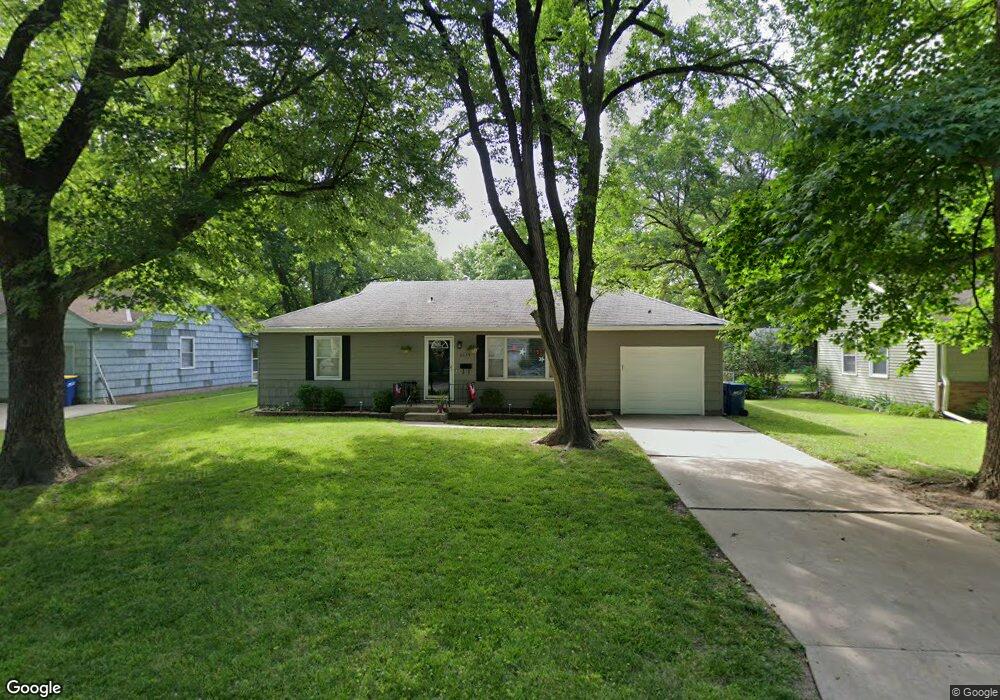
6039 Juniper Dr Mission, KS 66205
Estimated Value: $280,000 - $322,000
3
Beds
1
Bath
1,044
Sq Ft
$294/Sq Ft
Est. Value
About This Home
This home is located at 6039 Juniper Dr, Mission, KS 66205 and is currently estimated at $307,219, approximately $294 per square foot. 6039 Juniper Dr is a home located in Johnson County with nearby schools including Highlands Elementary School, Indian Hills Middle School, and Shawnee Mission East High School.
Ownership History
Date
Name
Owned For
Owner Type
Purchase Details
Closed on
Feb 2, 2021
Sold by
Platko Randolyn and Sereres Randolyn
Bought by
Kc Real Estate Llc
Current Estimated Value
Purchase Details
Closed on
Aug 30, 2005
Sold by
Goodman David K
Bought by
Sereres Randolyn
Purchase Details
Closed on
Mar 11, 2005
Sold by
Secretary Of Hud
Bought by
Goodman David K
Purchase Details
Closed on
Feb 14, 2003
Sold by
Landreth Mark E
Bought by
Landreth Pamela E
Purchase Details
Closed on
Nov 30, 2001
Sold by
Shortell Thomas P and Shortell Susan Ann
Bought by
Landreth Mark E and Landreth Pam J
Home Financials for this Owner
Home Financials are based on the most recent Mortgage that was taken out on this home.
Original Mortgage
$104,176
Interest Rate
6.59%
Mortgage Type
FHA
Create a Home Valuation Report for This Property
The Home Valuation Report is an in-depth analysis detailing your home's value as well as a comparison with similar homes in the area
Home Values in the Area
Average Home Value in this Area
Purchase History
| Date | Buyer | Sale Price | Title Company |
|---|---|---|---|
| Kc Real Estate Llc | -- | None Available | |
| Kc Real Estate Llc | -- | None Listed On Document | |
| Sereres Randolyn | -- | First American Title | |
| Goodman David K | -- | Security Land Title Co | |
| Landreth Pamela E | -- | -- | |
| Landreth Mark E | -- | Chicago Title Insurance Co |
Source: Public Records
Mortgage History
| Date | Status | Borrower | Loan Amount |
|---|---|---|---|
| Previous Owner | Landreth Mark E | $104,176 |
Source: Public Records
Tax History Compared to Growth
Tax History
| Year | Tax Paid | Tax Assessment Tax Assessment Total Assessment is a certain percentage of the fair market value that is determined by local assessors to be the total taxable value of land and additions on the property. | Land | Improvement |
|---|---|---|---|---|
| 2024 | $3,727 | $29,670 | $8,809 | $20,861 |
| 2023 | $3,751 | $29,291 | $8,002 | $21,289 |
| 2022 | $3,397 | $26,680 | $7,273 | $19,407 |
| 2021 | $3,003 | $21,919 | $6,063 | $15,856 |
| 2020 | $2,902 | $20,734 | $5,269 | $15,465 |
| 2019 | $2,718 | $19,147 | $3,291 | $15,856 |
| 2018 | $2,548 | $17,526 | $3,291 | $14,235 |
| 2017 | $2,451 | $16,502 | $3,291 | $13,211 |
| 2016 | $2,314 | $15,214 | $3,291 | $11,923 |
| 2015 | $2,240 | $14,697 | $3,291 | $11,406 |
| 2013 | -- | $14,122 | $3,291 | $10,831 |
Source: Public Records
Map
Nearby Homes
- 6241 Rosewood Ct
- 6247 Rosewood St
- 6234 Ash St
- 5914 Granada St
- 6108 Fontana St
- 4607 W 59th St
- 5940 Nall Ave
- 6015 Fontana St
- 6000 El Monte St
- 6000 Maple St
- 6101 El Monte St
- 6316 Granada Dr
- 5111 W 64th St
- 4402 W 63rd Terrace
- 4214 W 59th St
- 5817 Fontana Dr
- 4811 W 65th Terrace
- 5600 Roe Blvd
- 5013 W 65th Terrace
- 4304 Brookridge Dr
- 6035 Juniper Dr
- 6043 Juniper Dr
- 6031 Juniper Dr
- 6047 Juniper Dr
- 4732 W 61st St
- 4736 W 61st St
- 4728 W 61st St
- 6040 Juniper Dr
- 4740 W 61st St
- 6042 Juniper Dr
- 6051 Juniper Dr
- 6038 Juniper Dr
- 6044 Juniper Dr
- 6029 Juniper Dr
- 6034 Juniper Dr
- 4724 W 61st St
- 4748 W 61st Terrace
- 6046 Juniper Dr
- 6055 Juniper Dr
- 4800 W 61st Terrace