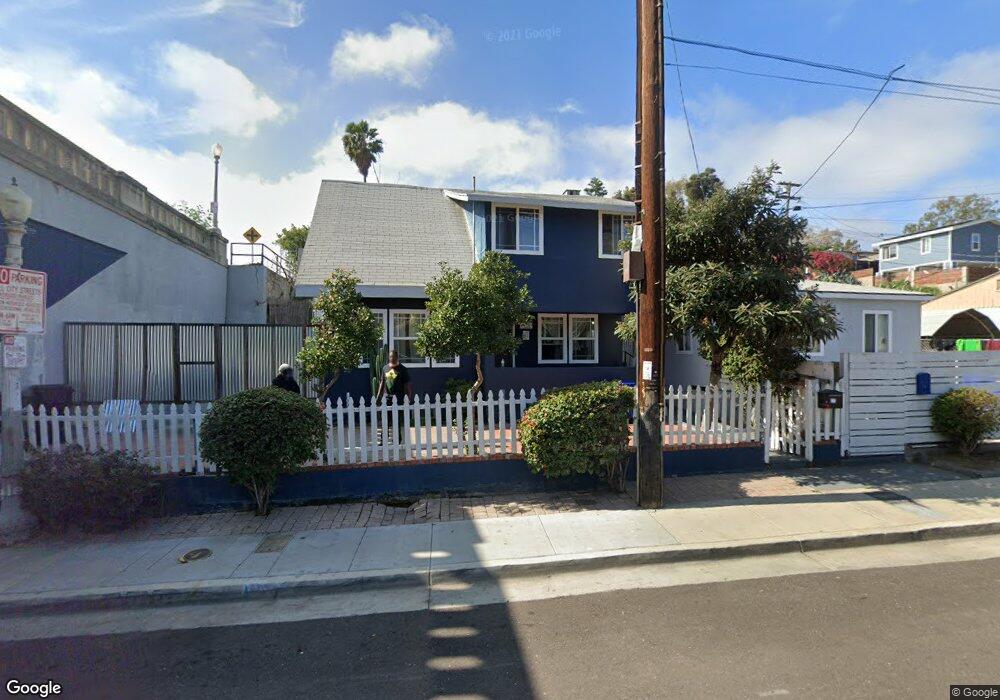
604 28th St Unit 8 San Diego, CA 92102
Grant Hill NeighborhoodEstimated Value: $741,000 - $1,370,000
4
Beds
2
Baths
1,880
Sq Ft
$542/Sq Ft
Est. Value
About This Home
This home is located at 604 28th St Unit 8, San Diego, CA 92102 and is currently estimated at $1,018,988, approximately $542 per square foot. 604 28th St Unit 8 is a home located in San Diego County with nearby schools including Kimbrough Elementary School, Logan Memorial Educational Campus, and Albert Einstein Academy.
Ownership History
Date
Name
Owned For
Owner Type
Purchase Details
Closed on
Apr 10, 2000
Sold by
Whitehead Norman A and Whitehead Keri L
Bought by
Gonzalez Pablo Antonio
Current Estimated Value
Purchase Details
Closed on
May 7, 1999
Sold by
Sunderland Ira A C 8223
Bought by
Whitehead Norman A and Whitehead Keri L
Home Financials for this Owner
Home Financials are based on the most recent Mortgage that was taken out on this home.
Original Mortgage
$108,000
Interest Rate
7.63%
Purchase Details
Closed on
Oct 2, 1997
Sold by
Sunderland Chris I
Bought by
Bank Of Commerce
Purchase Details
Closed on
Oct 1, 1997
Sold by
Bank Of Commerce
Bought by
Sunderland Chris I
Purchase Details
Closed on
Jul 22, 1997
Sold by
Spurlock William F
Bought by
Bank Of Commerce
Purchase Details
Closed on
May 1, 1989
Create a Home Valuation Report for This Property
The Home Valuation Report is an in-depth analysis detailing your home's value as well as a comparison with similar homes in the area
Home Values in the Area
Average Home Value in this Area
Purchase History
| Date | Buyer | Sale Price | Title Company |
|---|---|---|---|
| Gonzalez Pablo Antonio | -- | Chicago Title Co | |
| Whitehead Norman A | $84,000 | Lawyers Title | |
| Bank Of Commerce | -- | -- | |
| Sunderland Chris I | -- | -- | |
| Sunderland Chris I | -- | -- | |
| Bank Of Commerce | $23,971 | Old Republic Title Company | |
| -- | $89,000 | -- |
Source: Public Records
Mortgage History
| Date | Status | Borrower | Loan Amount |
|---|---|---|---|
| Previous Owner | Whitehead Norman A | $108,000 | |
| Closed | Whitehead Norman A | $16,000 |
Source: Public Records
Tax History Compared to Growth
Tax History
| Year | Tax Paid | Tax Assessment Tax Assessment Total Assessment is a certain percentage of the fair market value that is determined by local assessors to be the total taxable value of land and additions on the property. | Land | Improvement |
|---|---|---|---|---|
| 2025 | $2,349 | $192,099 | $130,634 | $61,465 |
| 2024 | $2,349 | $188,333 | $128,073 | $60,260 |
| 2023 | $2,296 | $184,641 | $125,562 | $59,079 |
| 2022 | $2,235 | $181,021 | $123,100 | $57,921 |
| 2021 | $2,220 | $177,473 | $120,687 | $56,786 |
| 2020 | $2,194 | $175,654 | $119,450 | $56,204 |
| 2019 | $2,155 | $172,210 | $117,108 | $55,102 |
| 2018 | $2,016 | $168,834 | $114,812 | $54,022 |
| 2017 | $1,968 | $165,524 | $112,561 | $52,963 |
| 2016 | $1,935 | $162,279 | $110,354 | $51,925 |
| 2015 | $1,907 | $159,843 | $108,697 | $51,146 |
| 2014 | $1,878 | $156,713 | $106,568 | $50,145 |
Source: Public Records
Map
Nearby Homes
- 918-32 27th St
- 918-32 27th St Unit 918-32
- 2832 K St
- 0 J St Unit NDP2509260
- 2847 Broadway
- 2863 Broadway Unit 105
- 3043 Market St
- 2680 L St
- 2942 N L St
- 2650 Broadway Unit 101
- 2650 Broadway Unit 110
- 244 26th St
- 3068 G St
- 2950 Broadway Unit 16
- 2917 C St Unit 187
- 2930 Broadway Unit 55
- 2911 C St Unit 95
- 3029 Broadway Unit 4
- 2701-11 Imperial Ave
- 2891 B St
- 2774 Market St Unit 76
- 618 28th St
- 607 28th St
- 2768 Market St
- 540 28th St Unit 42
- 2783 Market St
- 2762 Market St
- 2760 Market St Unit 4
- 2760 Market St Unit 3
- 2760 Market St Unit 1
- 2760 Market St Unit 5
- 2760 Market St
- 2760 Market St Unit 1-4
- 2775 G St Unit 77
- 2787 G St
- 2775 Market St Unit 77
- 565 28th St
- 565 28th St
- 2767 G St Unit 71
- 532 28th St