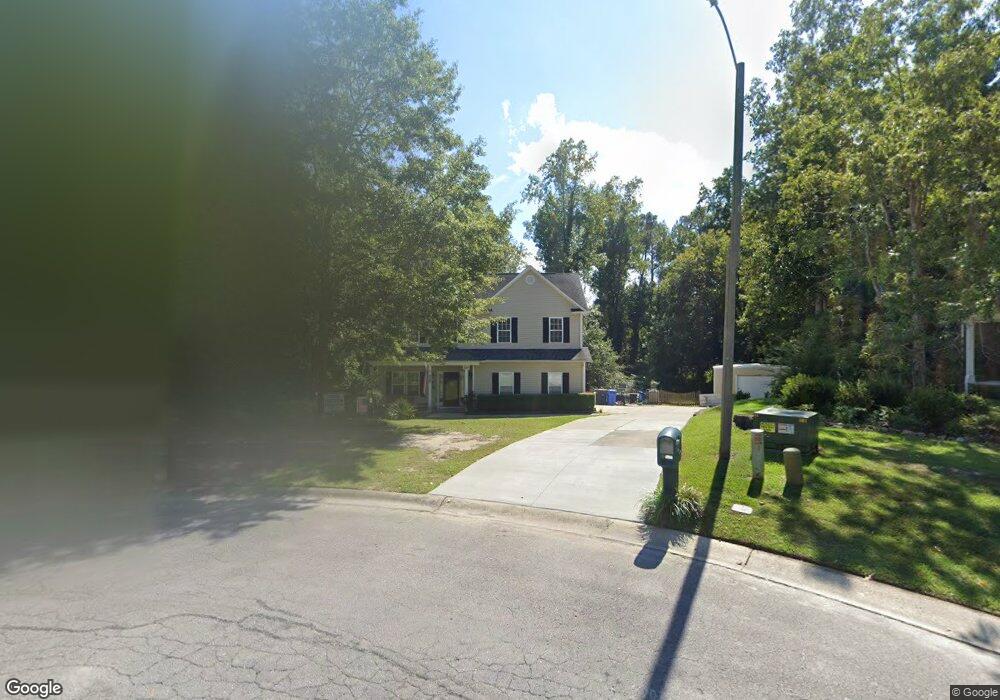
604 Chandler Ct Jacksonville, NC 28546
Estimated Value: $345,006 - $365,000
4
Beds
3
Baths
2,320
Sq Ft
$152/Sq Ft
Est. Value
About This Home
This home is located at 604 Chandler Ct, Jacksonville, NC 28546 and is currently estimated at $353,002, approximately $152 per square foot. 604 Chandler Ct is a home located in Onslow County with nearby schools including Bell Fork Elementary School, White Oak High School, and Fellowship Christian Academy.
Ownership History
Date
Name
Owned For
Owner Type
Purchase Details
Closed on
May 7, 2009
Sold by
Walston Stanley C and Walston Karen R
Bought by
Ellison Clint and Ellison Greta
Current Estimated Value
Home Financials for this Owner
Home Financials are based on the most recent Mortgage that was taken out on this home.
Original Mortgage
$255,375
Outstanding Balance
$161,004
Interest Rate
4.81%
Mortgage Type
VA
Estimated Equity
$191,998
Purchase Details
Closed on
Mar 3, 2005
Sold by
A R Bell Construction Inc
Bought by
Walston Stanley C and Walston Karen R
Home Financials for this Owner
Home Financials are based on the most recent Mortgage that was taken out on this home.
Original Mortgage
$41,480
Interest Rate
5.61%
Mortgage Type
Credit Line Revolving
Create a Home Valuation Report for This Property
The Home Valuation Report is an in-depth analysis detailing your home's value as well as a comparison with similar homes in the area
Home Values in the Area
Average Home Value in this Area
Purchase History
| Date | Buyer | Sale Price | Title Company |
|---|---|---|---|
| Ellison Clint | $250,000 | None Available | |
| Walston Stanley C | $206,000 | None Available |
Source: Public Records
Mortgage History
| Date | Status | Borrower | Loan Amount |
|---|---|---|---|
| Open | Ellison Clint | $255,375 | |
| Previous Owner | Walston Stanley C | $41,480 | |
| Previous Owner | Walston Stanley C | $164,720 |
Source: Public Records
Tax History Compared to Growth
Tax History
| Year | Tax Paid | Tax Assessment Tax Assessment Total Assessment is a certain percentage of the fair market value that is determined by local assessors to be the total taxable value of land and additions on the property. | Land | Improvement |
|---|---|---|---|---|
| 2025 | $3,356 | $270,267 | $35,000 | $235,267 |
| 2024 | $3,356 | $267,414 | $35,000 | $232,414 |
| 2023 | $3,356 | $267,414 | $35,000 | $232,414 |
| 2022 | $3,356 | $267,414 | $35,000 | $232,414 |
| 2021 | $2,697 | $200,220 | $35,000 | $165,220 |
| 2020 | $2,697 | $200,220 | $35,000 | $165,220 |
| 2019 | $2,697 | $200,220 | $35,000 | $165,220 |
| 2018 | $2,697 | $200,220 | $35,000 | $165,220 |
| 2017 | $2,384 | $180,980 | $40,000 | $140,980 |
| 2016 | $2,384 | $180,980 | $0 | $0 |
| 2015 | $2,384 | $180,980 | $0 | $0 |
| 2014 | $2,384 | $180,980 | $0 | $0 |
Source: Public Records
Map
Nearby Homes
- 103 Huff Ct
- 902 Welsh Ln
- 402 Huff Dr
- 103 Dunhill Ct
- 914 Eton Dr
- 111 Bedford Green
- 512 E Springhill Terrace
- 514 E Springhill Terrace
- 705 Ireland Ct
- 305 Timberlake Trail
- 105 Kenan Loop
- 504 Greenbriar Dr
- 404 Hampshire Place
- 125 Linda Loop
- 108 Kingsmill Ct
- 405 Hampshire Place
- 503 Mark Ln
- 103 Summercreek Dr
- 422 Pine Valley Rd
- 625 Winchester Rd