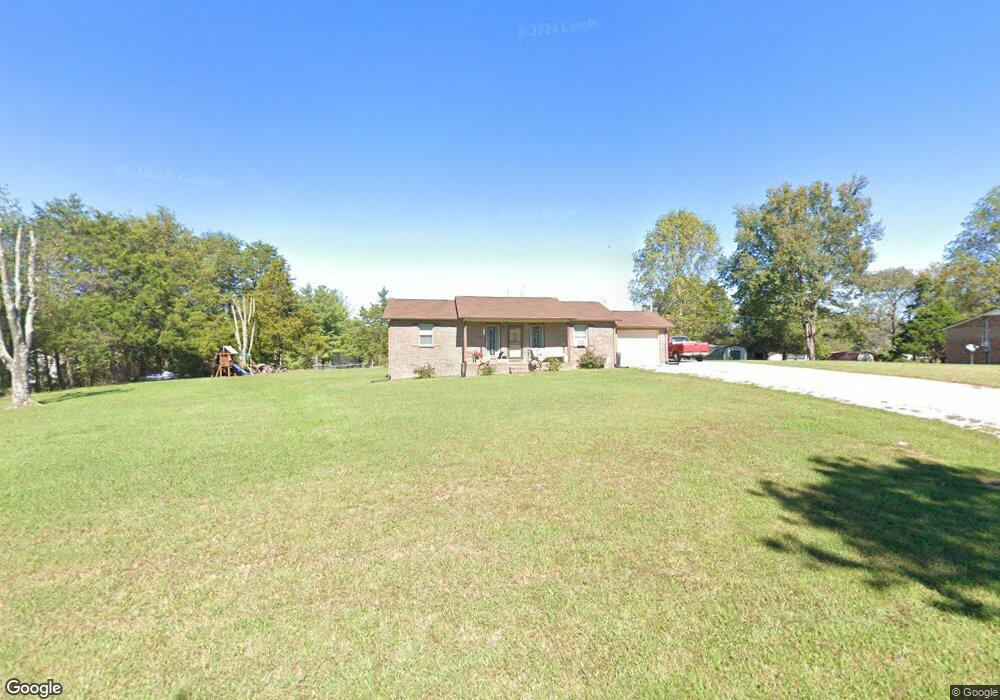
604 Cindy Dr Cookeville, TN 38506
Estimated Value: $182,982 - $272,000
--
Bed
1
Bath
1,170
Sq Ft
$192/Sq Ft
Est. Value
About This Home
This home is located at 604 Cindy Dr, Cookeville, TN 38506 and is currently estimated at $224,496, approximately $191 per square foot. 604 Cindy Dr is a home located in Putnam County with nearby schools including Cookeville High School, Algood Middle School, and Northeast Elementary School.
Ownership History
Date
Name
Owned For
Owner Type
Purchase Details
Closed on
Jul 8, 2021
Sold by
Hadlock Timothy and Hadlock Tanya M
Bought by
Reed Kevin C and Reed Martha J
Current Estimated Value
Home Financials for this Owner
Home Financials are based on the most recent Mortgage that was taken out on this home.
Original Mortgage
$109,200
Outstanding Balance
$99,082
Interest Rate
2.9%
Mortgage Type
New Conventional
Estimated Equity
$125,414
Purchase Details
Closed on
Mar 28, 2011
Sold by
Letner Tanya M
Bought by
Hadlock Timothy
Purchase Details
Closed on
Jan 1, 1986
Bought by
Letner Tanya M
Create a Home Valuation Report for This Property
The Home Valuation Report is an in-depth analysis detailing your home's value as well as a comparison with similar homes in the area
Home Values in the Area
Average Home Value in this Area
Purchase History
| Date | Buyer | Sale Price | Title Company |
|---|---|---|---|
| Reed Kevin C | $136,500 | None Available | |
| Hadlock Timothy | -- | -- | |
| Letner Tanya M | $4,000 | -- |
Source: Public Records
Mortgage History
| Date | Status | Borrower | Loan Amount |
|---|---|---|---|
| Open | Reed Kevin C | $109,200 |
Source: Public Records
Tax History Compared to Growth
Tax History
| Year | Tax Paid | Tax Assessment Tax Assessment Total Assessment is a certain percentage of the fair market value that is determined by local assessors to be the total taxable value of land and additions on the property. | Land | Improvement |
|---|---|---|---|---|
| 2024 | $920 | $34,575 | $3,575 | $31,000 |
| 2023 | $920 | $34,575 | $3,575 | $31,000 |
| 2022 | $855 | $34,575 | $3,575 | $31,000 |
| 2021 | $727 | $29,400 | $3,575 | $25,825 |
| 2020 | $634 | $29,400 | $3,575 | $25,825 |
| 2019 | $634 | $21,675 | $3,575 | $18,100 |
| 2018 | $592 | $21,675 | $3,575 | $18,100 |
| 2017 | $592 | $21,675 | $3,575 | $18,100 |
| 2016 | $592 | $21,675 | $3,575 | $18,100 |
| 2015 | $629 | $22,425 | $4,325 | $18,100 |
| 2014 | $597 | $21,282 | $0 | $0 |
Source: Public Records
Map
Nearby Homes