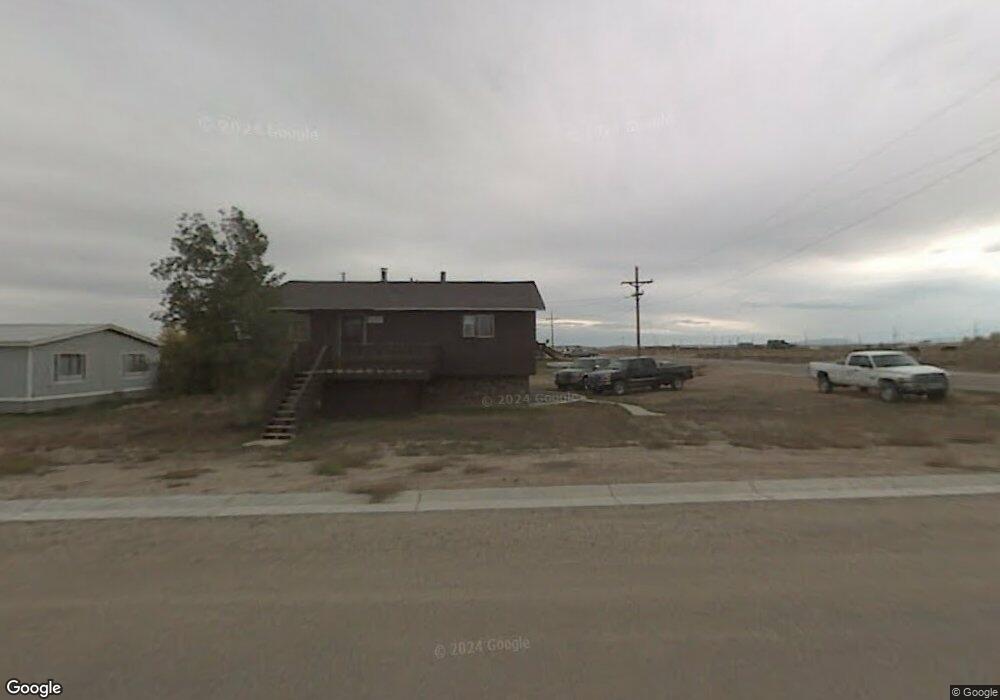
604 E 4th St Marbleton, WY 83113
Estimated Value: $190,000 - $264,656
4
Beds
2
Baths
1,836
Sq Ft
$123/Sq Ft
Est. Value
About This Home
This home is located at 604 E 4th St, Marbleton, WY 83113 and is currently estimated at $225,219, approximately $122 per square foot. 604 E 4th St is a home located in Sublette County with nearby schools including Big Piney High School.
Ownership History
Date
Name
Owned For
Owner Type
Purchase Details
Closed on
Sep 11, 2020
Sold by
Johnson Matthew A and Johnson Stacy Beth
Bought by
Frink Michael T and Frink Wendy D
Current Estimated Value
Home Financials for this Owner
Home Financials are based on the most recent Mortgage that was taken out on this home.
Original Mortgage
$91,615
Outstanding Balance
$81,151
Interest Rate
2.8%
Mortgage Type
New Conventional
Estimated Equity
$144,068
Purchase Details
Closed on
Jan 10, 2019
Sold by
Johnson Matthew A
Bought by
Johnson Matthew A and Johnson Stacy Beth
Purchase Details
Closed on
Nov 3, 2008
Sold by
Corwin Scott M and Corwin Anna M
Bought by
Johnson Matthew A
Home Financials for this Owner
Home Financials are based on the most recent Mortgage that was taken out on this home.
Original Mortgage
$143,000
Interest Rate
5.83%
Mortgage Type
FHA
Create a Home Valuation Report for This Property
The Home Valuation Report is an in-depth analysis detailing your home's value as well as a comparison with similar homes in the area
Purchase History
| Date | Buyer | Sale Price | Title Company |
|---|---|---|---|
| Frink Michael T | -- | First American Title | |
| Johnson Matthew A | -- | None Available | |
| Johnson Matthew A | -- | None Available |
Source: Public Records
Mortgage History
| Date | Status | Borrower | Loan Amount |
|---|---|---|---|
| Open | Frink Michael T | $91,615 | |
| Previous Owner | Johnson Matthew A | $143,000 |
Source: Public Records
Tax History
| Year | Tax Paid | Tax Assessment Tax Assessment Total Assessment is a certain percentage of the fair market value that is determined by local assessors to be the total taxable value of land and additions on the property. | Land | Improvement |
|---|---|---|---|---|
| 2025 | $1,043 | $15,108 | $3,098 | $12,010 |
| 2024 | $1,296 | $18,865 | $3,972 | $14,893 |
| 2023 | $1,172 | $17,126 | $3,707 | $13,419 |
| 2022 | $1,031 | $15,011 | $3,446 | $11,565 |
| 2021 | $864 | $13,048 | $3,171 | $9,877 |
| 2020 | $864 | $12,889 | $2,870 | $10,019 |
| 2019 | $782 | $11,638 | $2,826 | $8,812 |
| 2018 | $737 | $10,969 | $2,978 | $7,991 |
| 2017 | $775 | $11,354 | $3,135 | $8,219 |
| 2016 | $729 | $10,761 | $3,135 | $7,626 |
| 2015 | -- | $11,220 | $3,135 | $8,085 |
| 2014 | -- | $11,081 | $3,135 | $7,946 |
| 2013 | -- | $11,813 | $3,230 | $8,583 |
Source: Public Records
Map
Nearby Homes
- 716 3rd St
- 723 E 4th St
- 723 E Fourth St
- 803 3rd St
- TBD E Second St (L1 B2)
- 712 E 1st St
- 922 3rd St
- 1013 3rd St
- LOT 41 Meadow Canyon Dr
- 914 E 1st St
- 44 12th St
- 203 Winkelman Ave
- 106 2nd St
- 19 Taylor Ave
- 15 Taylor Ave
- 0 Tbd Unit 11605662
- 0 Tbd Unit 25622977
- 0 Tbd Unit 11610084
- 0 Tbd Unit 25533787
- 0 Tbd Unit 25533788
Your Personal Tour Guide
Ask me questions while you tour the home.