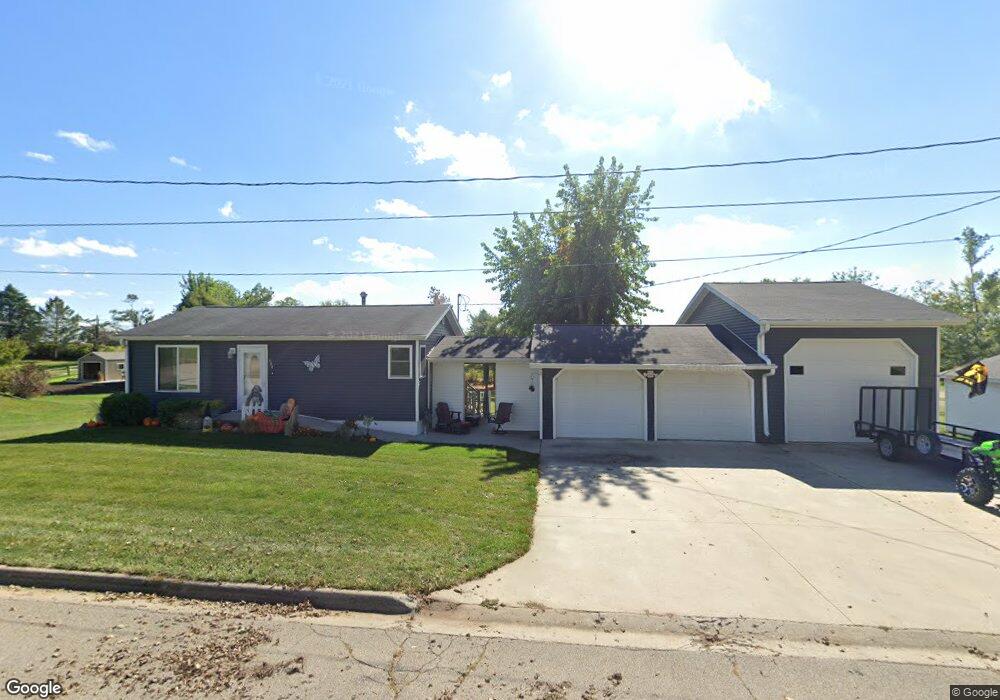
604 E Harrison St Unit TO Toledo, IA 52342
Estimated Value: $136,000 - $179,000
2
Beds
1
Bath
1,092
Sq Ft
$144/Sq Ft
Est. Value
About This Home
This home is located at 604 E Harrison St Unit TO, Toledo, IA 52342 and is currently estimated at $157,249, approximately $144 per square foot. 604 E Harrison St Unit TO is a home located in Tama County with nearby schools including South Tama County Elementary School, South Tama County Middle School, and South Tama County High School.
Ownership History
Date
Name
Owned For
Owner Type
Purchase Details
Closed on
Dec 3, 2015
Sold by
Oakland Properties Llc
Bought by
Steinlage Merle and Steinlage Louanne R
Current Estimated Value
Home Financials for this Owner
Home Financials are based on the most recent Mortgage that was taken out on this home.
Original Mortgage
$75,000
Outstanding Balance
$45,405
Interest Rate
3.78%
Mortgage Type
New Conventional
Estimated Equity
$111,844
Purchase Details
Closed on
May 17, 2013
Sold by
Werner Louanne R
Bought by
Werner Louanne R and Steinlage Merle A
Purchase Details
Closed on
Nov 11, 2010
Sold by
Farrell Judith Elle and Farrell Ronald
Bought by
Werner Louanne R
Home Financials for this Owner
Home Financials are based on the most recent Mortgage that was taken out on this home.
Original Mortgage
$24,993
Interest Rate
4.3%
Mortgage Type
New Conventional
Create a Home Valuation Report for This Property
The Home Valuation Report is an in-depth analysis detailing your home's value as well as a comparison with similar homes in the area
Home Values in the Area
Average Home Value in this Area
Purchase History
| Date | Buyer | Sale Price | Title Company |
|---|---|---|---|
| Steinlage Merle | $52,000 | None Available | |
| Werner Louanne R | -- | None Available | |
| Werner Louanne R | $25,000 | None Available |
Source: Public Records
Mortgage History
| Date | Status | Borrower | Loan Amount |
|---|---|---|---|
| Open | Steinlage Merle | $75,000 | |
| Previous Owner | Werner Louanne R | $24,993 |
Source: Public Records
Tax History Compared to Growth
Tax History
| Year | Tax Paid | Tax Assessment Tax Assessment Total Assessment is a certain percentage of the fair market value that is determined by local assessors to be the total taxable value of land and additions on the property. | Land | Improvement |
|---|---|---|---|---|
| 2024 | $2,494 | $136,810 | $17,280 | $119,530 |
| 2023 | $2,304 | $136,810 | $17,280 | $119,530 |
| 2022 | $2,276 | $110,640 | $17,280 | $93,360 |
| 2021 | $2,190 | $110,160 | $16,370 | $93,790 |
| 2020 | $20 | $103,250 | $16,370 | $86,880 |
| 2019 | $2,030 | $93,760 | $12,730 | $81,030 |
| 2018 | $1,978 | $93,760 | $12,730 | $81,030 |
| 2017 | $1,938 | $93,760 | $12,730 | $81,030 |
| 2016 | $1,822 | $87,450 | $12,730 | $74,720 |
| 2015 | $1,514 | $87,450 | $12,730 | $74,720 |
| 2014 | $1,514 | $75,190 | $15,920 | $59,270 |
Source: Public Records
Map
Nearby Homes
- 205 E Grace St
- 209 S Ann St
- 608 S Broadway St
- 201 E Ross St
- 707 E Carleton St
- 403 E Carleton St
- 201 E Ohio St
- 804 S Main St
- 804 N Court St
- 707 E High St
- 303 E State St
- 204 N Harrison St
- 100 W Myrtle St
- 301 N Broadway St
- 0 1st Ave
- 406 N East St
- 1010 Oakland Dr Unit TA
- 1511 State St
- 1404 Siegel St Unit TA
- 301 W 13th St
- 606 E Harrison St Unit TO
- 801 S Elm St Unit TO
- 607 E Harrison St
- 707 S Elm St
- 609 E Harrison St
- 611 E Harrison St
- 610 E Harrison St
- 604 E College St
- 613 E Harrison St
- 602 E College St
- 701 S Elm St
- 606 E College St
- 608 E College St
- 706 S Willow St
- 610 E College St
- 612 E College St
- 605 E College St
- 607 S Elm St
- 609 E College St
- 700 E Harrison St