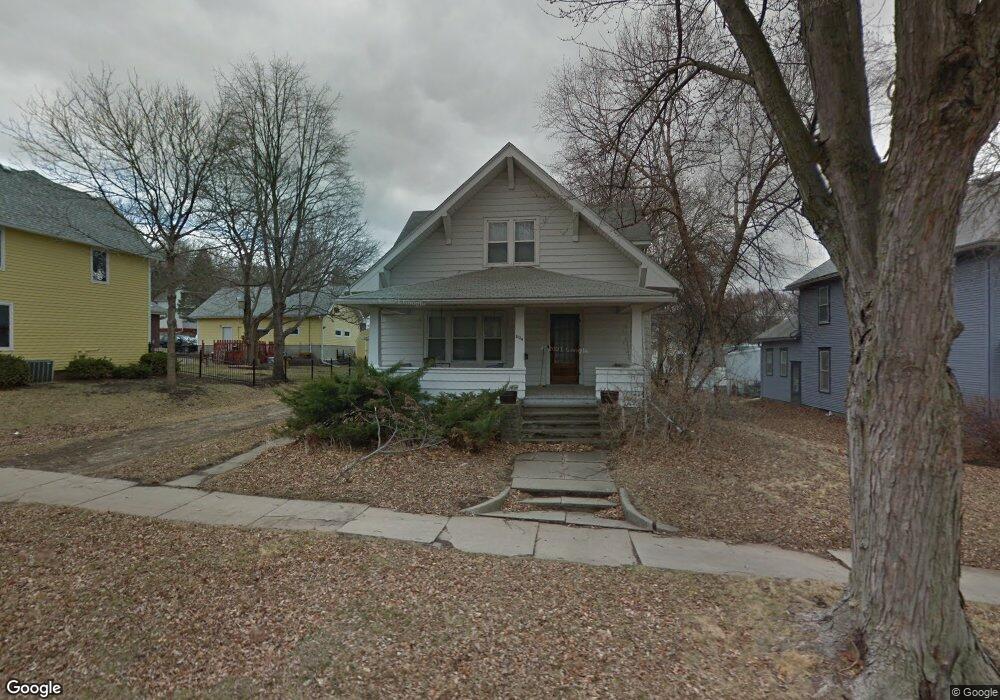
604 E Maple St Red Oak, IA 51566
Estimated Value: $107,000 - $135,000
4
Beds
3
Baths
1,686
Sq Ft
$70/Sq Ft
Est. Value
About This Home
This home is located at 604 E Maple St, Red Oak, IA 51566 and is currently estimated at $118,211, approximately $70 per square foot. 604 E Maple St is a home located in Montgomery County with nearby schools including Red Oak Early Childhood Center, Red Oak Middle School, and Red Oak Junior/Senior High School.
Ownership History
Date
Name
Owned For
Owner Type
Purchase Details
Closed on
Feb 6, 2018
Sold by
Miller Barry J Est
Bought by
Swartz Tiffany L
Current Estimated Value
Home Financials for this Owner
Home Financials are based on the most recent Mortgage that was taken out on this home.
Original Mortgage
$40,064
Outstanding Balance
$33,931
Interest Rate
3.99%
Mortgage Type
FHA
Estimated Equity
$84,280
Purchase Details
Closed on
Nov 25, 2014
Sold by
Miller Pamela Finley
Bought by
Miller Barry James
Create a Home Valuation Report for This Property
The Home Valuation Report is an in-depth analysis detailing your home's value as well as a comparison with similar homes in the area
Home Values in the Area
Average Home Value in this Area
Purchase History
| Date | Buyer | Sale Price | Title Company |
|---|---|---|---|
| Swartz Tiffany L | $52,000 | -- | |
| Miller Barry James | -- | None Available |
Source: Public Records
Mortgage History
| Date | Status | Borrower | Loan Amount |
|---|---|---|---|
| Open | Swartz Tiffany L | $40,064 |
Source: Public Records
Tax History
| Year | Tax Paid | Tax Assessment Tax Assessment Total Assessment is a certain percentage of the fair market value that is determined by local assessors to be the total taxable value of land and additions on the property. | Land | Improvement |
|---|---|---|---|---|
| 2025 | $2,022 | $105,670 | $13,130 | $92,540 |
| 2024 | $2,022 | $86,140 | $9,850 | $76,290 |
| 2023 | $1,904 | $86,140 | $9,850 | $76,290 |
| 2022 | $1,790 | $70,590 | $9,850 | $60,740 |
| 2021 | $1,734 | $70,590 | $9,850 | $60,740 |
| 2020 | $1,734 | $65,070 | $9,850 | $55,220 |
| 2019 | $1,344 | $65,070 | $9,850 | $55,220 |
| 2018 | $1,202 | $59,550 | $0 | $0 |
| 2017 | $1,202 | $59,550 | $0 | $0 |
| 2015 | $1,138 | $59,550 | $0 | $0 |
| 2014 | $1,622 | $65,530 | $0 | $0 |
Source: Public Records
Map
Nearby Homes