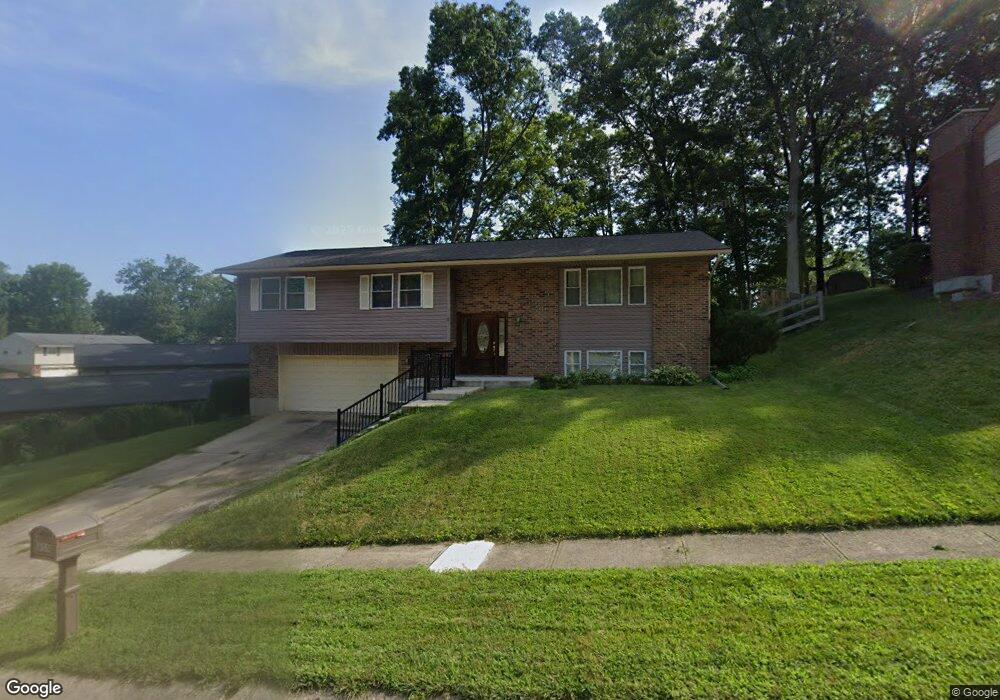
604 Kings Cross Ct Dayton, OH 45449
Estimated Value: $263,000 - $288,000
3
Beds
3
Baths
2,248
Sq Ft
$124/Sq Ft
Est. Value
About This Home
This home is located at 604 Kings Cross Ct, Dayton, OH 45449 and is currently estimated at $279,137, approximately $124 per square foot. 604 Kings Cross Ct is a home located in Montgomery County with nearby schools including West Carrollton High School and Bethel Baptist School.
Ownership History
Date
Name
Owned For
Owner Type
Purchase Details
Closed on
Jul 14, 2017
Sold by
Cox Krisanna L and Runyan Charles
Bought by
Anderson Matthew D and Anderson Laura N
Current Estimated Value
Home Financials for this Owner
Home Financials are based on the most recent Mortgage that was taken out on this home.
Original Mortgage
$119,120
Outstanding Balance
$98,969
Interest Rate
3.89%
Mortgage Type
Future Advance Clause Open End Mortgage
Estimated Equity
$180,168
Purchase Details
Closed on
Apr 25, 2014
Sold by
Perron Thomas M and Perron Pamela K
Bought by
Cox Krisanna L
Home Financials for this Owner
Home Financials are based on the most recent Mortgage that was taken out on this home.
Original Mortgage
$135,500
Interest Rate
4.25%
Mortgage Type
FHA
Purchase Details
Closed on
Oct 15, 2003
Sold by
Perron Thomas M and Perron Pamela K
Bought by
Perron Thomas M and Perron Pamela K
Create a Home Valuation Report for This Property
The Home Valuation Report is an in-depth analysis detailing your home's value as well as a comparison with similar homes in the area
Home Values in the Area
Average Home Value in this Area
Purchase History
| Date | Buyer | Sale Price | Title Company |
|---|---|---|---|
| Anderson Matthew D | $148,900 | Fidelity Lawyers Title Agenc | |
| Cox Krisanna L | $138,000 | Landmark Title Agency S Inc | |
| Perron Thomas M | -- | -- |
Source: Public Records
Mortgage History
| Date | Status | Borrower | Loan Amount |
|---|---|---|---|
| Open | Anderson Matthew D | $119,120 | |
| Previous Owner | Cox Krisanna L | $135,500 |
Source: Public Records
Tax History Compared to Growth
Tax History
| Year | Tax Paid | Tax Assessment Tax Assessment Total Assessment is a certain percentage of the fair market value that is determined by local assessors to be the total taxable value of land and additions on the property. | Land | Improvement |
|---|---|---|---|---|
| 2024 | $4,492 | $74,390 | $11,730 | $62,660 |
| 2023 | $4,492 | $74,390 | $11,730 | $62,660 |
| 2022 | $4,256 | $55,510 | $8,750 | $46,760 |
| 2021 | $4,264 | $55,510 | $8,750 | $46,760 |
| 2020 | $4,263 | $55,510 | $8,750 | $46,760 |
| 2019 | $3,778 | $45,390 | $8,750 | $36,640 |
| 2018 | $3,534 | $45,390 | $8,750 | $36,640 |
| 2017 | $3,509 | $45,390 | $8,750 | $36,640 |
| 2016 | $3,461 | $43,680 | $8,750 | $34,930 |
| 2015 | $3,174 | $43,680 | $8,750 | $34,930 |
| 2014 | $3,174 | $43,680 | $8,750 | $34,930 |
| 2012 | -- | $41,720 | $12,250 | $29,470 |
Source: Public Records
Map
Nearby Homes
- 609 Kings Cross Ct
- 500 Lincoln Green Dr
- 432 Crusader Dr
- 1100 S Elm St
- 2125 Sherwood Forest Dr
- 1153 King Richard Pkwy
- 275 Orchard Hill Dr
- 2302 King Richard Pkwy
- 838 Maid Marion Ct
- 1803 Cudgell Dr
- 1320 S Alex Rd
- 1606 Pine Tree Ln Unit 38
- 430 Donington Dr
- 429 Wilson Park Dr
- 354 Ellenwood Dr
- 700 N Gebhart Church Rd
- 1000 Skyview Dr
- 2061 Pine Forest Dr
- 1109 Arrowhead Crossing Unit A
- 1104 Arrowhead Crossing Unit B
- 608 Kings Cross Ct
- 600 Kings Cross Ct
- 1375 King Richard Pkwy
- 612 Kings Cross Ct
- 1261 S Elm St
- 605 Kings Cross Ct
- 1361 King Richard Pkwy
- 1259 S Elm St
- 613 Kings Cross Ct
- 1372 King Richard Pkwy
- 1368 King Richard Pkwy
- 1376 King Richard Pkwy
- 1364 King Richard Pkwy
- 1357 King Richard Pkwy
- 1380 King Richard Pkwy
- 617 Kings Cross Ct
- 1255 S Elm St
- 621 Kings Cross Ct
- 10 Forest Park Ct
- 1384 King Richard Pkwy