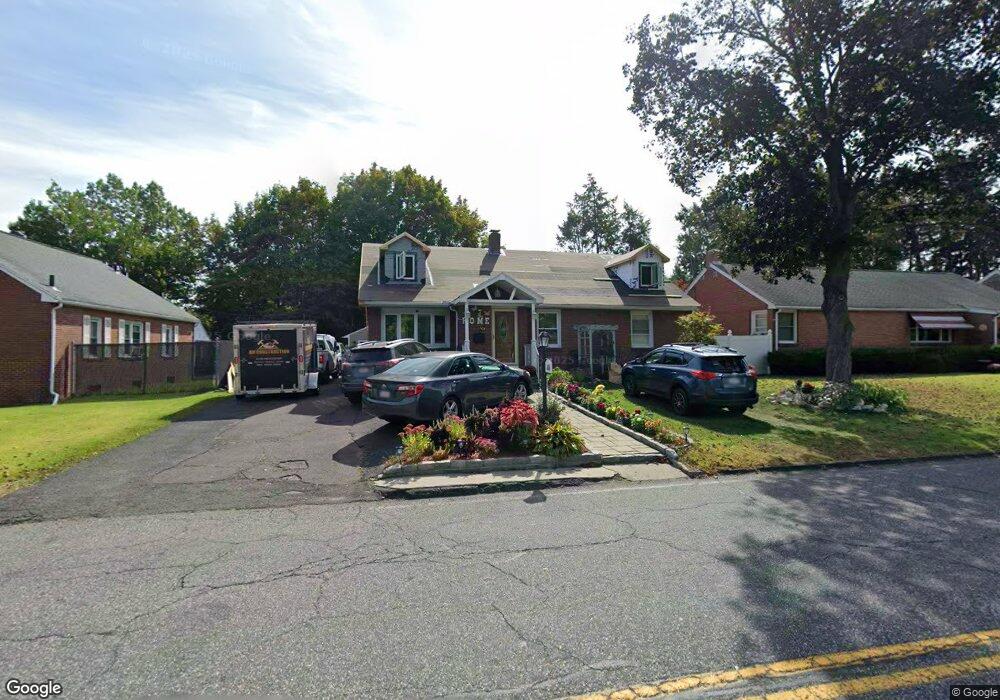
604 Pleasant St Holyoke, MA 01040
Estimated Value: $270,460 - $383,000
4
Beds
2
Baths
1,780
Sq Ft
$172/Sq Ft
Est. Value
About This Home
This home is located at 604 Pleasant St, Holyoke, MA 01040 and is currently estimated at $306,865, approximately $172 per square foot. 604 Pleasant St is a home located in Hampden County with nearby schools including Maurice A. Donahue Elementary School, Holyoke High School, and Mater Dolorosa Elementary School.
Ownership History
Date
Name
Owned For
Owner Type
Purchase Details
Closed on
Mar 30, 2009
Sold by
Barcome John J and Barcome Faith E
Bought by
Figueroa Arcadio and Figueroa Zoraida
Current Estimated Value
Home Financials for this Owner
Home Financials are based on the most recent Mortgage that was taken out on this home.
Original Mortgage
$154,057
Outstanding Balance
$98,430
Interest Rate
5.14%
Mortgage Type
Purchase Money Mortgage
Estimated Equity
$208,435
Create a Home Valuation Report for This Property
The Home Valuation Report is an in-depth analysis detailing your home's value as well as a comparison with similar homes in the area
Home Values in the Area
Average Home Value in this Area
Purchase History
| Date | Buyer | Sale Price | Title Company |
|---|---|---|---|
| Figueroa Arcadio | $156,900 | -- |
Source: Public Records
Mortgage History
| Date | Status | Borrower | Loan Amount |
|---|---|---|---|
| Open | Figueroa Arcadio | $154,057 |
Source: Public Records
Tax History
| Year | Tax Paid | Tax Assessment Tax Assessment Total Assessment is a certain percentage of the fair market value that is determined by local assessors to be the total taxable value of land and additions on the property. | Land | Improvement |
|---|---|---|---|---|
| 2025 | $4,135 | $236,800 | $41,800 | $195,000 |
| 2024 | $3,919 | $206,800 | $39,700 | $167,100 |
| 2023 | $3,741 | $199,400 | $39,700 | $159,700 |
| 2022 | $3,596 | $186,700 | $39,700 | $147,000 |
| 2021 | $3,378 | $175,300 | $36,100 | $139,200 |
| 2020 | $3,192 | $167,300 | $36,100 | $131,200 |
| 2019 | $2,957 | $153,300 | $30,400 | $122,900 |
| 2018 | $2,810 | $146,900 | $30,400 | $116,500 |
| 2017 | $2,816 | $146,900 | $30,400 | $116,500 |
| 2016 | $2,558 | $133,800 | $30,400 | $103,400 |
| 2015 | $2,548 | $133,800 | $30,400 | $103,400 |
Source: Public Records
Map
Nearby Homes
- 275 Suffolk St
- 225-227 Beech St
- 301-303 Linden St
- 219 Suffolk St
- 179 Sargeant St
- 9 Owens Place
- 1022-1024 Hampden St
- 143 Sycamore St
- 391 Pleasant St
- 192 Chestnut St
- 1225 Hampden St
- 1705-1707 Northampton St
- 76 Nonotuck St
- 25 Morgan St
- 27 Morgan St
- 51-53 Ridgewood Ave
- 3 Park View Terrace Unit 3
- 99-101 High St
- 1825 Northampton St
- 60 Chapin St Unit D
- 608 Pleasant St
- 600 Pleasant St
- 612 Pleasant St
- 37 Sycamore St
- 37 Sycamore St
- 39 Sycamore St
- 307 Cabot St
- 303 Cabot St
- 36 Sycamore St
- 45 Sycamore St
- 38 Sycamore St
- 266 Essex St
- 589 Pleasant St Unit 4R
- 40 Sycamore St
- 42 Sycamore St
- 73 Locust St
- 40 Forestdale Ave
- 97 Locust St
- 294 Cabot St
- 577 Pleasant St Unit 1L
Your Personal Tour Guide
Ask me questions while you tour the home.