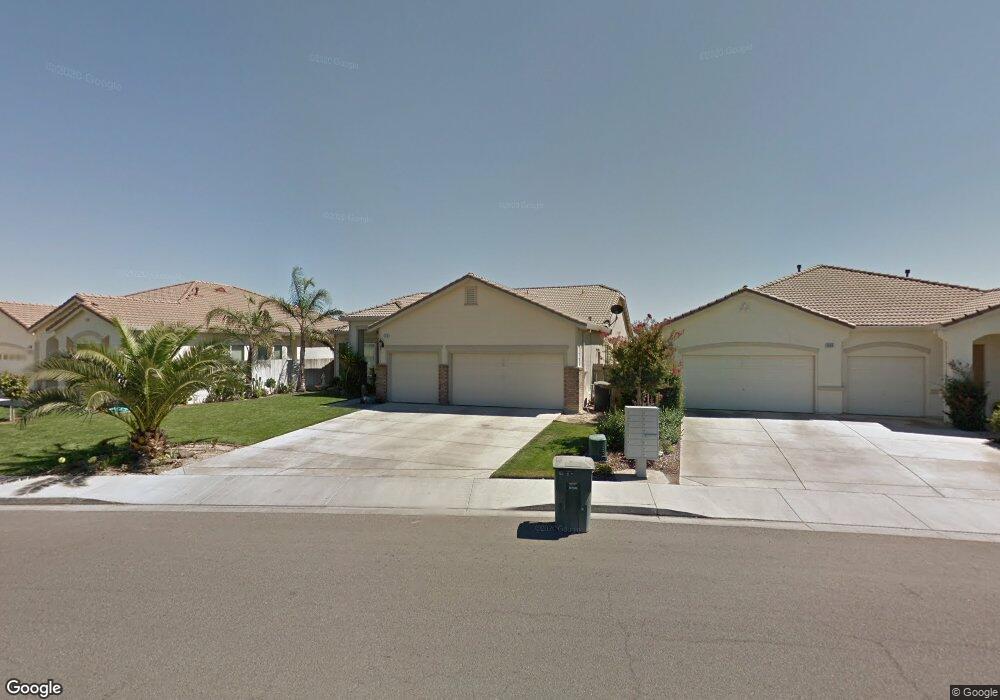
604 Rodeo Grounds Way Newman, CA 95360
Estimated Value: $473,000 - $513,824
4
Beds
2
Baths
2,188
Sq Ft
$221/Sq Ft
Est. Value
About This Home
This home is located at 604 Rodeo Grounds Way, Newman, CA 95360 and is currently estimated at $484,206, approximately $221 per square foot. 604 Rodeo Grounds Way is a home located in Stanislaus County with nearby schools including Orestimba High School.
Ownership History
Date
Name
Owned For
Owner Type
Purchase Details
Closed on
Jan 12, 2018
Sold by
Martins Mario and Martins Helen H
Bought by
Martins Dillon A and Martins Micayla M
Current Estimated Value
Home Financials for this Owner
Home Financials are based on the most recent Mortgage that was taken out on this home.
Original Mortgage
$220,924
Outstanding Balance
$185,521
Interest Rate
3.75%
Mortgage Type
FHA
Estimated Equity
$298,685
Purchase Details
Closed on
Jun 22, 2015
Sold by
Souza George and Souza Marlene
Bought by
Martins Mario and Martins Helen
Purchase Details
Closed on
Jul 15, 2010
Sold by
Donelson Hazel L
Bought by
Souza George and Souza Marlene
Purchase Details
Closed on
Dec 15, 2003
Sold by
Woodside Lucas Ranch Inc
Bought by
Donelson Hazel L
Home Financials for this Owner
Home Financials are based on the most recent Mortgage that was taken out on this home.
Original Mortgage
$260,000
Interest Rate
7.12%
Mortgage Type
Purchase Money Mortgage
Create a Home Valuation Report for This Property
The Home Valuation Report is an in-depth analysis detailing your home's value as well as a comparison with similar homes in the area
Home Values in the Area
Average Home Value in this Area
Purchase History
| Date | Buyer | Sale Price | Title Company |
|---|---|---|---|
| Martins Dillon A | $225,000 | Cypress Title Corp | |
| Martins Mario | $180,000 | Stewart Title Of Ca Inc | |
| Souza George | $123,000 | None Available | |
| Donelson Hazel L | $290,000 | Old Republic |
Source: Public Records
Mortgage History
| Date | Status | Borrower | Loan Amount |
|---|---|---|---|
| Open | Martins Dillon A | $220,924 | |
| Previous Owner | Donelson Hazel L | $260,000 |
Source: Public Records
Tax History Compared to Growth
Tax History
| Year | Tax Paid | Tax Assessment Tax Assessment Total Assessment is a certain percentage of the fair market value that is determined by local assessors to be the total taxable value of land and additions on the property. | Land | Improvement |
|---|---|---|---|---|
| 2025 | $3,895 | $319,667 | $54,078 | $265,589 |
| 2024 | $3,796 | $313,400 | $53,018 | $260,382 |
| 2023 | $3,691 | $307,256 | $51,979 | $255,277 |
| 2022 | $3,532 | $293,232 | $50,960 | $242,272 |
| 2021 | $3,470 | $287,483 | $49,961 | $237,522 |
| 2020 | $3,400 | $284,536 | $49,449 | $235,087 |
| 2019 | $3,409 | $278,958 | $48,480 | $230,478 |
| 2018 | $3,101 | $258,783 | $47,530 | $211,253 |
| 2017 | $3,356 | $253,710 | $46,599 | $207,111 |
| 2016 | $2,983 | $248,736 | $45,686 | $203,050 |
| 2015 | $2,291 | $178,019 | $42,639 | $135,380 |
| 2014 | $2,270 | $174,533 | $41,804 | $132,729 |
Source: Public Records
Map
Nearby Homes
- 1939 L St
- 501 Flour Mill Dr
- 1328 Basil Ct
- 1335 Eucalyptus Ave
- 619-657 Inyo Ave
- 1542 P St
- 1166 Labrador Ct
- 1057 Aiden Dr
- 2218 Sunshine Dr
- 345 Cinnamon Teal Way
- 2224 Sunshine Dr
- 1118 Strawbridge Dr
- 2211 Sunshine Dr
- 2223 Sunshine Dr
- 2229 Sunshine Dr
- 1115 Pintail Ct
- 2203 Mia Dr
- 2222 Mia Dr
- 2209 Mia Dr
- 2215 Mia Dr
- 554 Bonanza Dr
- 608 Rodeo Grounds Way
- 550 Bonanza Dr
- 612 Rodeo Grounds Way
- 546 Bonanza Dr
- 616 Rodeo Grounds Way
- 542 Rodeo Grounds Way
- 542 Bonanza Dr
- 620 Rodeo Grounds Way
- 547 Rodeo Grounds Way
- 538 Rodeo Grounds Way
- 543 Bonanza Dr
- 538 Bonanza Dr
- 624 Rodeo Grounds Way
- 543 Rodeo Grounds Way
- 534 Rodeo Grounds Way
- 537 Bonanza Dr
- 1530 Rose Park Dr
- 534 Bonanza Dr
- 539 Rodeo Grounds Way