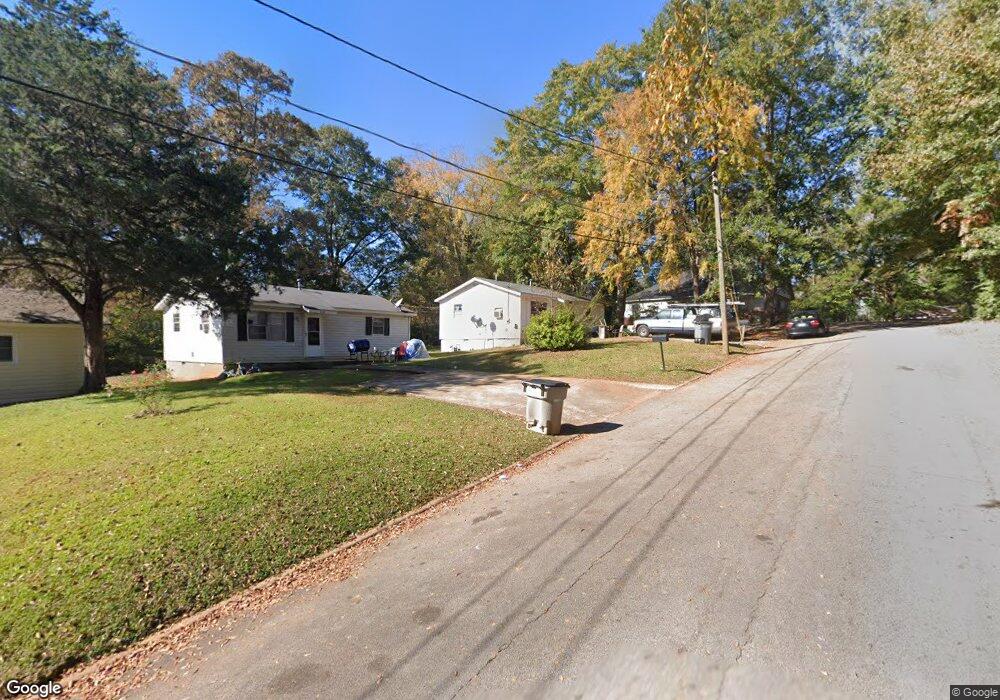
604 S Alford St Lagrange, GA 30240
Estimated Value: $182,000 - $228,000
2
Beds
2
Baths
748
Sq Ft
$283/Sq Ft
Est. Value
About This Home
This home is located at 604 S Alford St, Lagrange, GA 30240 and is currently estimated at $211,631, approximately $282 per square foot. 604 S Alford St is a home located in Troup County with nearby schools including Ethel W. Kight Elementary School, Hollis Hand Elementary School, and Franklin Forest Elementary School.
Ownership History
Date
Name
Owned For
Owner Type
Purchase Details
Closed on
Aug 15, 2024
Sold by
Brbrshy Investments Inc
Bought by
Wren Robert L Trust and Wren Roth Ira Robert L
Current Estimated Value
Purchase Details
Closed on
Nov 30, 2021
Sold by
T Squared 1 Llc
Bought by
Brbrshy Investments Inc
Purchase Details
Closed on
Jun 1, 2021
Sold by
Stribling Ty
Bought by
T Squared 2 Llc
Purchase Details
Closed on
Apr 25, 2006
Sold by
Matthews James Ralph
Bought by
Matthews James Ralph and Jackson Janice Faye Co
Purchase Details
Closed on
Jul 29, 1971
Bought by
Matthews James Ralph and Matthews Janice
Purchase Details
Closed on
Jun 1, 1970
Sold by
Jenkins Donald R
Purchase Details
Closed on
Nov 11, 1969
Sold by
Hagedorn Phillip H
Bought by
Jenkins Donald R
Purchase Details
Closed on
May 1, 1958
Sold by
Hagedorn Mrs Zach
Bought by
Hagedorn Phillip H
Create a Home Valuation Report for This Property
The Home Valuation Report is an in-depth analysis detailing your home's value as well as a comparison with similar homes in the area
Home Values in the Area
Average Home Value in this Area
Purchase History
| Date | Buyer | Sale Price | Title Company |
|---|---|---|---|
| Wren Robert L Trust | $64,650 | -- | |
| Brbrshy Investments Inc | $12,484,500 | -- | |
| T Squared 2 Llc | -- | -- | |
| Matthews James Ralph | -- | -- | |
| Matthews James Ralph | -- | -- | |
| -- | -- | -- | |
| Jenkins Donald R | $4,200 | -- | |
| Hagedorn Phillip H | -- | -- |
Source: Public Records
Tax History Compared to Growth
Tax History
| Year | Tax Paid | Tax Assessment Tax Assessment Total Assessment is a certain percentage of the fair market value that is determined by local assessors to be the total taxable value of land and additions on the property. | Land | Improvement |
|---|---|---|---|---|
| 2024 | $2,694 | $98,784 | $17,640 | $81,144 |
| 2023 | $2,564 | $94,004 | $17,640 | $76,364 |
| 2022 | $2,519 | $90,244 | $17,640 | $72,604 |
| 2021 | $1,368 | $45,372 | $17,640 | $27,732 |
| 2020 | $1,368 | $45,372 | $17,640 | $27,732 |
| 2019 | $1,250 | $41,452 | $14,120 | $27,332 |
| 2018 | $1,250 | $41,452 | $14,120 | $27,332 |
| 2017 | $1,250 | $41,452 | $14,120 | $27,332 |
| 2016 | $1,243 | $41,225 | $13,248 | $27,978 |
| 2015 | $1,059 | $41,225 | $13,248 | $27,978 |
| 2014 | $1,247 | $41,225 | $13,248 | $27,978 |
| 2013 | -- | $61,868 | $17,664 | $44,204 |
Source: Public Records
Map
Nearby Homes
- 613 Murphy Ave
- 611 Murphy Ave
- 618 S Alford St
- 613 S Alford St
- 609 Murphy Ave
- 602 S Alford St
- 615 Murphy Ave
- 617 S Alford St
- 619 S Alford St
- 612 Murphy Ave
- 606 Harwell Ave
- 512 Miller St
- 510 Miller St
- 605 Murphy Ave
- 616 Murphy Ave
- 301 Wilkes St
- 608 Harwell Ave
- 303 Wilkes St
- 209 Wilkes St
- 618 Murphy Ave