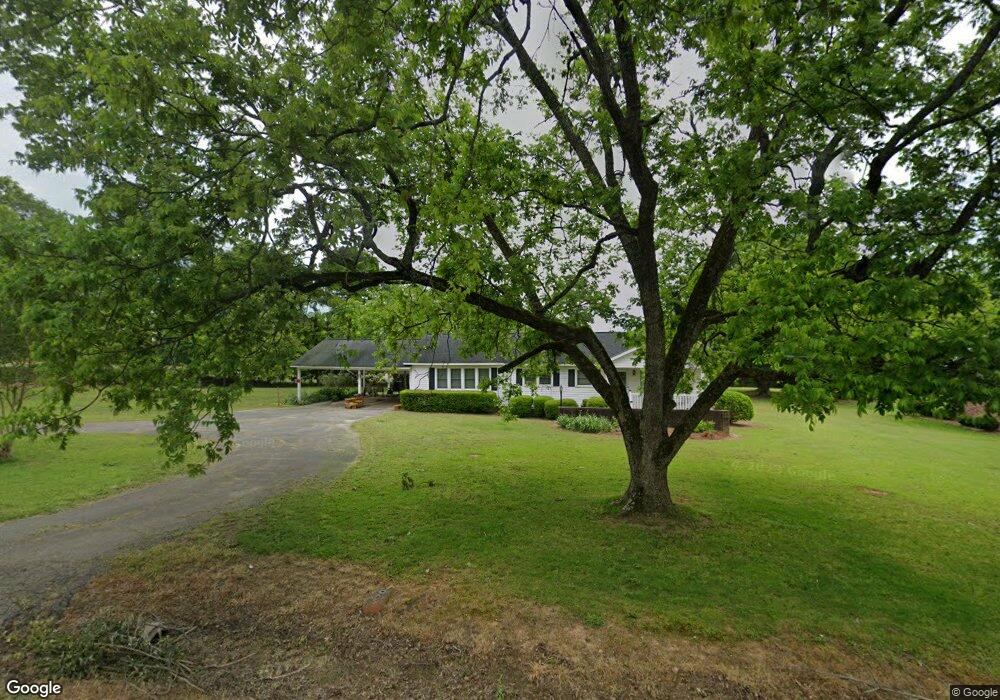
604 S Washington St Lincolnton, GA 30817
Estimated Value: $118,000 - $205,000
3
Beds
3
Baths
1,566
Sq Ft
$108/Sq Ft
Est. Value
About This Home
This home is located at 604 S Washington St, Lincolnton, GA 30817 and is currently estimated at $169,731, approximately $108 per square foot. 604 S Washington St is a home located in Lincoln County with nearby schools including Lincoln County Elementary School, Lincoln County Middle School, and Lincoln County High School.
Ownership History
Date
Name
Owned For
Owner Type
Purchase Details
Closed on
May 23, 2023
Sold by
Freeman Gena T
Bought by
Dawkins Shirley N and Antonakos Elizabeth D
Current Estimated Value
Purchase Details
Closed on
Feb 11, 2021
Sold by
Freeman Gena T
Bought by
Dawkins Shirley N and Antonakos Elizabeth D
Purchase Details
Closed on
Feb 29, 2008
Sold by
Freeman Chad
Bought by
Freeman Gena T
Purchase Details
Closed on
Dec 8, 2000
Sold by
Farmers State Bank
Bought by
Freeman Chad and Freeman Gena T
Purchase Details
Closed on
Aug 11, 1987
Sold by
Tankerlsey Lillian B
Bought by
Guthrie Ernest I
Purchase Details
Closed on
Jan 11, 1982
Sold by
Norman Walker T
Bought by
Tankersley Lillian B
Purchase Details
Closed on
Nov 19, 1976
Sold by
Mccoy Estelle Est
Bought by
Norman Walker T
Purchase Details
Closed on
Sep 1, 1976
Bought by
Mccoy Estelle Est
Create a Home Valuation Report for This Property
The Home Valuation Report is an in-depth analysis detailing your home's value as well as a comparison with similar homes in the area
Home Values in the Area
Average Home Value in this Area
Purchase History
| Date | Buyer | Sale Price | Title Company |
|---|---|---|---|
| Dawkins Shirley N | $2,000 | -- | |
| Dawkins Shirley N | -- | -- | |
| Freeman Gena T | $49,740 | -- | |
| Freeman Chad | -- | -- | |
| Freeman Chad | $65,000 | -- | |
| Guthrie Ernest I | $45,000 | -- | |
| Tankersley Lillian B | $18,700 | -- | |
| Norman Walker T | $18,400 | -- | |
| Mccoy Estelle Est | -- | -- |
Source: Public Records
Tax History Compared to Growth
Tax History
| Year | Tax Paid | Tax Assessment Tax Assessment Total Assessment is a certain percentage of the fair market value that is determined by local assessors to be the total taxable value of land and additions on the property. | Land | Improvement |
|---|---|---|---|---|
| 2025 | $1,387 | $47,920 | $3,480 | $44,440 |
| 2024 | $1,414 | $44,400 | $3,320 | $41,080 |
| 2023 | $541 | $38,880 | $2,960 | $35,920 |
| 2022 | $885 | $37,400 | $2,960 | $34,440 |
| 2021 | $880 | $33,800 | $2,560 | $31,240 |
| 2020 | $819 | $27,320 | $2,560 | $24,760 |
| 2019 | $792 | $26,360 | $2,560 | $23,800 |
| 2018 | $1,006 | $26,360 | $2,560 | $23,800 |
| 2017 | $1,172 | $30,700 | $3,920 | $26,780 |
| 2016 | $900 | $30,700 | $3,920 | $26,780 |
| 2015 | -- | $30,700 | $3,920 | $26,780 |
| 2014 | -- | $30,220 | $3,920 | $26,300 |
| 2013 | -- | $34,020 | $3,920 | $30,100 |
Source: Public Records
Map
Nearby Homes
- 280 May Ave
- Lot 32 Eagle Point
- Na Metasville Rd
- 0 Watson St
- 118 Humphrey St
- 168 Ext Watson St
- 125 Elm St
- 125 Goshen St
- 202 Goshen St
- 570 Wallace-Wells Cir
- 1460 Leathersville Rd
- 1118 Augusta Hwy
- 116 Jackie Way
- 00 C E Norman Rd
- 00A Elberton Hwy
- LOT 4 Elberton Hwy
- Lot 3a Elberton Hwy
- 200 Cathy Way
- 000 Georgia 220
- 0 Georgia 220 Unit TRACT B 10468309
- 614 S Washington St
- 624 S Washington St
- 636 S Washington St
- 607 S Washington St
- 540 S Washington St
- 472 S Washington St
- 494 S Washington St
- 484 S Washington St
- 448 S Washington St
- 1005 Washington Hwy
- 1021 Washington Hwy
- 1022 Washington Hwy
- 1053 Washington Hwy
- 0 Friendship Church Rd Unit 10021125
- 265 Lumber St
- 145 Lincoln Ave
- 1115A Lincoln Ave
- 128 Martin St
- 241 Lumber St