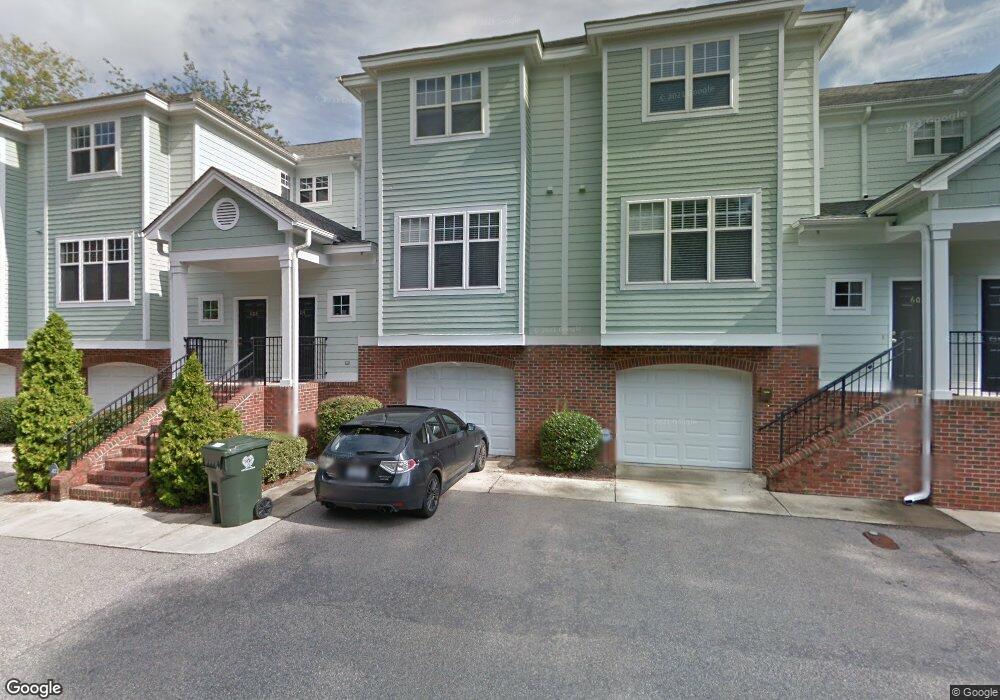
604 Scales Towne Ct Unit a Raleigh, NC 27608
Five Points NeighborhoodEstimated Value: $529,000 - $681,000
2
Beds
3
Baths
1,672
Sq Ft
$347/Sq Ft
Est. Value
About This Home
This home is located at 604 Scales Towne Ct Unit a, Raleigh, NC 27608 and is currently estimated at $579,599, approximately $346 per square foot. 604 Scales Towne Ct Unit a is a home located in Wake County with nearby schools including Underwood Magnet Elementary School, Oberlin Middle School, and Broughton Magnet High School.
Ownership History
Date
Name
Owned For
Owner Type
Purchase Details
Closed on
Mar 30, 2022
Sold by
Roach Emily C
Bought by
Fogleman Jordan
Current Estimated Value
Home Financials for this Owner
Home Financials are based on the most recent Mortgage that was taken out on this home.
Original Mortgage
$400,000
Outstanding Balance
$376,394
Interest Rate
4.42%
Mortgage Type
New Conventional
Estimated Equity
$203,205
Purchase Details
Closed on
Jun 8, 2016
Sold by
Hoyt Scott S and Hoyt Andrea L
Bought by
Roach Emily C
Purchase Details
Closed on
Mar 23, 2015
Sold by
Dematteis Giovanni A
Bought by
Hoyt S Scott
Purchase Details
Closed on
Mar 4, 2013
Sold by
Matteis Joelle F De and Kelly Gaelle P
Bought by
Matteis Giovanni A De
Purchase Details
Closed on
Dec 19, 2000
Sold by
Five Points Partners Of Raleigh Llc
Bought by
Dematteis Patrice
Create a Home Valuation Report for This Property
The Home Valuation Report is an in-depth analysis detailing your home's value as well as a comparison with similar homes in the area
Home Values in the Area
Average Home Value in this Area
Purchase History
| Date | Buyer | Sale Price | Title Company |
|---|---|---|---|
| Fogleman Jordan | $505,000 | None Listed On Document | |
| Roach Emily C | $333,500 | None Available | |
| Hoyt S Scott | $248,000 | None Available | |
| Matteis Giovanni A De | -- | None Available | |
| Dematteis Patrice | $220,000 | -- |
Source: Public Records
Mortgage History
| Date | Status | Borrower | Loan Amount |
|---|---|---|---|
| Open | Fogleman Jordan | $400,000 |
Source: Public Records
Tax History Compared to Growth
Tax History
| Year | Tax Paid | Tax Assessment Tax Assessment Total Assessment is a certain percentage of the fair market value that is determined by local assessors to be the total taxable value of land and additions on the property. | Land | Improvement |
|---|---|---|---|---|
| 2025 | $4,314 | $492,335 | $165,000 | $327,335 |
| 2024 | $4,296 | $492,335 | $165,000 | $327,335 |
| 2023 | $3,977 | $363,020 | $115,000 | $248,020 |
| 2022 | $3,696 | $363,020 | $115,000 | $248,020 |
| 2021 | $3,552 | $363,020 | $115,000 | $248,020 |
| 2020 | $2,012 | $363,020 | $115,000 | $248,020 |
| 2019 | $3,470 | $297,711 | $100,000 | $197,711 |
| 2018 | $3,273 | $297,711 | $100,000 | $197,711 |
| 2017 | $3,117 | $297,711 | $100,000 | $197,711 |
| 2016 | $3,053 | $297,711 | $100,000 | $197,711 |
| 2015 | $2,760 | $264,563 | $100,000 | $164,563 |
| 2014 | -- | $264,563 | $100,000 | $164,563 |
Source: Public Records
Map
Nearby Homes
- 1402 Barton Place Dr
- 709 Caswell Heights Ln
- 1606 Scales St
- 1608 Scales St
- 1504 Caswell St
- 511 Hamilton Cottage Way
- 1710 Fairview Rd
- 206 Bickett Blvd
- 741 Bishops Park Dr Unit 306
- 741 Bishops Park Dr Unit 105
- 203 W West Roanoke Park Dr
- 730 Washington St Unit 205
- 1001 Brighthurst Dr Unit 306
- 1015 Harvey St
- 1000 Brighthurst Dr Unit 103
- 1120 Parkridge Ln Unit 102
- 620 Wade Ave Unit 506
- 620 Wade Ave Unit 505
- 620 Wade Ave Unit 103
- 1111 Parkridge Ln Unit 103
- 604 Scales Towne Ct
- 1420 Scales St
- 602 Scales Towne Ct
- 606 Scales Towne Ct
- 608 Scales Towne Ct
- 600 Scales Towne Ct
- 610 Scales Towne Ct
- 1422 Scales St Unit G
- 1422 Scales St
- 1422 Scales St
- 1422 Scales St Unit F
- 1422 Scales St Unit 13
- 1422 Scales St Unit D
- 1422 Scales St Unit C
- 1422 Scales St Unit M
- 1512 Faison Place
- 416 Morrison Ave
- 424 Morrison Ave
- 426 Morrison Ave
- 414 Morrison Ave