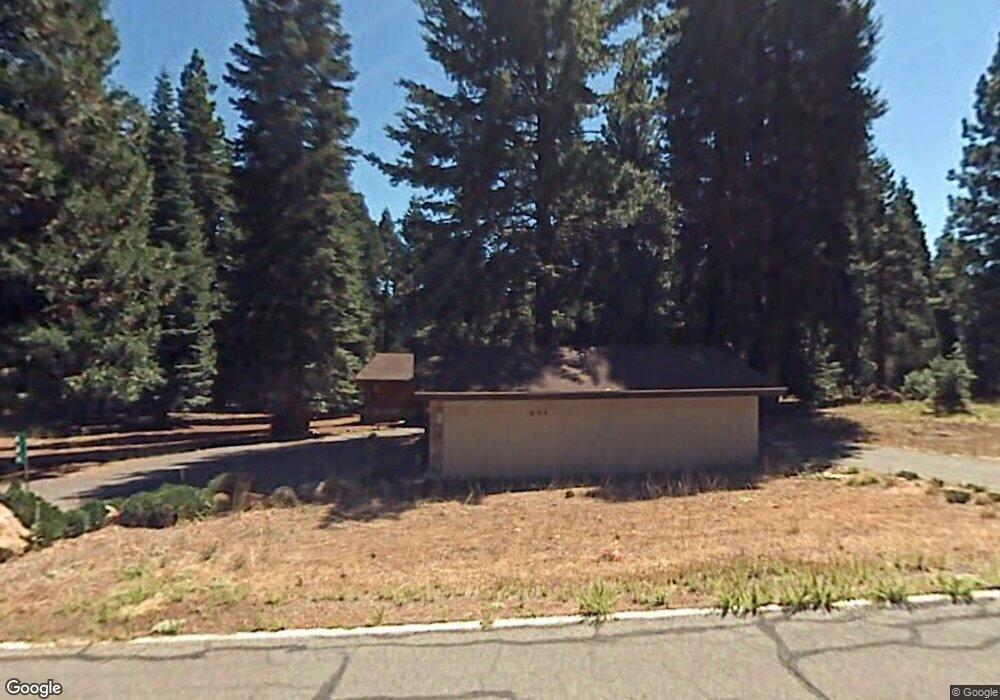
604 W Burnt Cedar Rd Unit 20 Westwood, CA 96137
Estimated Value: $459,531 - $539,000
3
Beds
2
Baths
1,408
Sq Ft
$357/Sq Ft
Est. Value
About This Home
This home is located at 604 W Burnt Cedar Rd Unit 20, Westwood, CA 96137 and is currently estimated at $502,633, approximately $356 per square foot. 604 W Burnt Cedar Rd Unit 20 is a home located in Plumas County with nearby schools including Lake Almanor Christian School.
Ownership History
Date
Name
Owned For
Owner Type
Purchase Details
Closed on
Dec 26, 2017
Sold by
Johnson Darren and Johnson Sandra
Bought by
Johnson Darren C and Johnson Sandra Sue
Current Estimated Value
Purchase Details
Closed on
May 12, 2016
Sold by
Cecil Jacob
Bought by
Boley Paul Robert and Boley Angela Dawn
Purchase Details
Closed on
Jul 18, 2013
Sold by
Johnson Darren and Johnson Sandra
Bought by
Johnson Darren C and Johnson Sandra Sue
Purchase Details
Closed on
Aug 6, 2004
Sold by
Demartile Bernice F and Bernice F Demartile 2003 Trust
Bought by
Johnson Darren and Johnson Sandra
Home Financials for this Owner
Home Financials are based on the most recent Mortgage that was taken out on this home.
Original Mortgage
$258,000
Interest Rate
5.75%
Mortgage Type
Purchase Money Mortgage
Purchase Details
Closed on
May 29, 2003
Sold by
Demartile Bernice F
Bought by
Demartile Bernice F and The Bernice F Demartile 2003 T
Create a Home Valuation Report for This Property
The Home Valuation Report is an in-depth analysis detailing your home's value as well as a comparison with similar homes in the area
Home Values in the Area
Average Home Value in this Area
Purchase History
| Date | Buyer | Sale Price | Title Company |
|---|---|---|---|
| Johnson Darren C | -- | Old Republic Title Co | |
| Johnson Darren | -- | Old Republic Title Co | |
| Boley Paul Robert | $21,500 | Cal Sierra Title Company | |
| Johnson Darren C | -- | None Available | |
| Johnson Darren | $322,500 | Ticor Title Company Of Ca | |
| Demartile Bernice F | -- | -- |
Source: Public Records
Mortgage History
| Date | Status | Borrower | Loan Amount |
|---|---|---|---|
| Previous Owner | Johnson Darren | $258,000 | |
| Closed | Johnson Darren | $0 |
Source: Public Records
Tax History Compared to Growth
Tax History
| Year | Tax Paid | Tax Assessment Tax Assessment Total Assessment is a certain percentage of the fair market value that is determined by local assessors to be the total taxable value of land and additions on the property. | Land | Improvement |
|---|---|---|---|---|
| 2025 | $5,516 | $449,522 | $181,203 | $268,319 |
| 2023 | $5,516 | $346,383 | $96,130 | $250,253 |
| 2022 | $4,127 | $339,591 | $94,245 | $245,346 |
| 2021 | $3,942 | $339,591 | $94,245 | $245,346 |
| 2020 | $4,012 | $334,781 | $94,245 | $240,536 |
| 2019 | $3,282 | $269,245 | $94,245 | $175,000 |
| 2018 | $2,887 | $239,396 | $94,245 | $145,151 |
| 2017 | $2,858 | $233,320 | $92,397 | $140,923 |
| 2016 | $2,629 | $226,525 | $89,706 | $136,819 |
| 2015 | $2,591 | $222,540 | $89,706 | $132,834 |
| 2014 | $2,594 | $222,540 | $89,706 | $132,834 |
Source: Public Records
Map
Nearby Homes
- 608 E Burnt Cedar Rd
- 600 Clifford Trail
- 615 Clifford Trail
- 614 E Burnt Cedar Rd
- 611 E Burnt Cedar Rd
- 625 W Burnt Cedar Rd
- 621 W Burnt Cedar Rd
- 642 W Burnt Cedar Rd
- 644 W Burnt Cedar Rd
- 623 W Mountain Ridge Rd
- 767 Lassen View Dr Unit 21
- 673 E Mountain Ridge Rd
- 615 E Mountain Ridge Rd
- 700 E Mountain Ridge Rd
- 777 Lassen View Dr
- 717 Conifer Trail
- 720 E Mountain Ridge Rd
- 629 Pine Canyon Rd
- 379 Clifford Dr
- 1129 Clifford Dr
- 600 W Burnt Cedar Rd
- 608 W Burnt Cedar Rd
- 607 Clifford Dr
- 607 Clifford Trail
- 603 Clifford Dr
- 606 Clifford Dr
- 606 Clifford Dr
- 607 W Burnt Cedar Rd
- 605 W Burnt Cedar Rd
- 603 W Burnt Cedar Rd
- 602 Clifford Trail
- 609 Clifford Dr
- 601 W Burnt Cedar Rd
- 601 W Burnt Cedar Rd Unit 20
- 604 Clifford Dr
- 610 Clifford Trail
- 602 Clifford Dr
- 613 W Burnt Cedar Rd
- 605 Clifford Trail
- 608 Clifford Dr