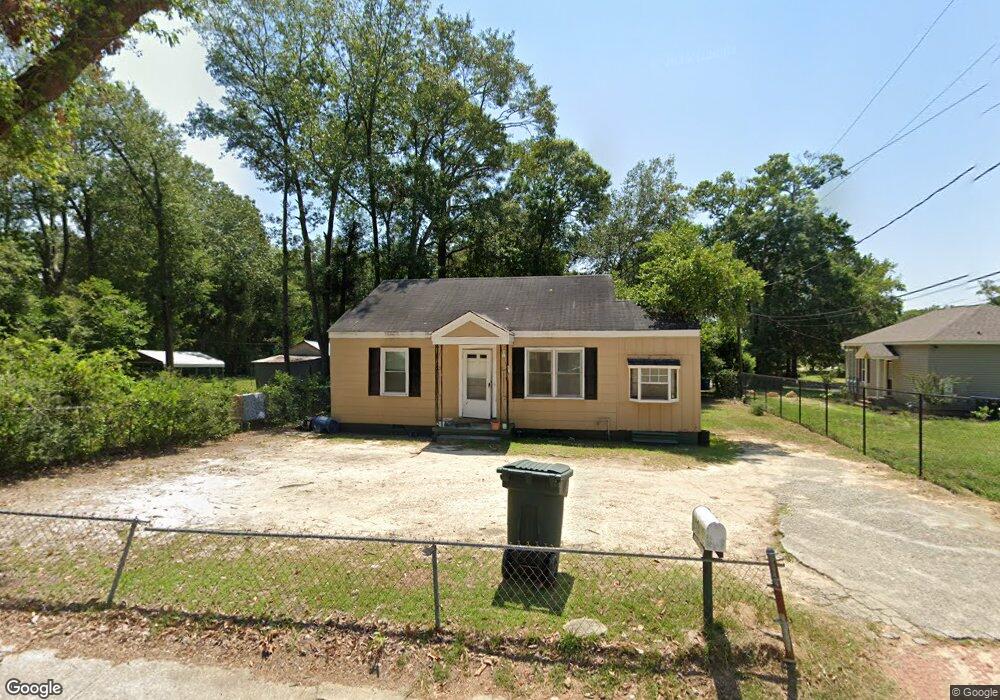
604 W Moore St Dublin, GA 31021
Estimated Value: $64,853 - $97,000
2
Beds
1
Bath
887
Sq Ft
$88/Sq Ft
Est. Value
About This Home
This home is located at 604 W Moore St, Dublin, GA 31021 and is currently estimated at $77,713, approximately $87 per square foot. 604 W Moore St is a home located in Laurens County with nearby schools including Susie Dasher, Moore Street School, and Dublin Middle School.
Ownership History
Date
Name
Owned For
Owner Type
Purchase Details
Closed on
Jan 13, 2019
Sold by
Highpoint Investment Holdings Llc
Bought by
Rockin C Investments Llc
Current Estimated Value
Home Financials for this Owner
Home Financials are based on the most recent Mortgage that was taken out on this home.
Original Mortgage
$19,350
Interest Rate
4.8%
Mortgage Type
New Conventional
Purchase Details
Closed on
Nov 30, 2018
Sold by
Robinson Sammie Lee
Bought by
Highpoint Investment Holdings Llc
Home Financials for this Owner
Home Financials are based on the most recent Mortgage that was taken out on this home.
Original Mortgage
$19,350
Interest Rate
4.8%
Mortgage Type
New Conventional
Purchase Details
Closed on
May 1, 1998
Sold by
Manning Allison H
Bought by
Robinson Sammie L
Purchase Details
Closed on
Dec 31, 1997
Sold by
Wilson Vonnie M
Bought by
Manning Allison H
Purchase Details
Closed on
Sep 9, 1909
Bought by
Wilson Vonnie M
Create a Home Valuation Report for This Property
The Home Valuation Report is an in-depth analysis detailing your home's value as well as a comparison with similar homes in the area
Home Values in the Area
Average Home Value in this Area
Purchase History
| Date | Buyer | Sale Price | Title Company |
|---|---|---|---|
| Rockin C Investments Llc | $25,000 | -- | |
| Highpoint Investment Holdings Llc | $18,000 | -- | |
| Robinson Sammie L | $23,500 | -- | |
| Manning Allison H | $17,500 | -- | |
| Wilson Vonnie M | -- | -- |
Source: Public Records
Mortgage History
| Date | Status | Borrower | Loan Amount |
|---|---|---|---|
| Closed | Highpoint Investment Holdings Llc | $19,350 |
Source: Public Records
Tax History Compared to Growth
Tax History
| Year | Tax Paid | Tax Assessment Tax Assessment Total Assessment is a certain percentage of the fair market value that is determined by local assessors to be the total taxable value of land and additions on the property. | Land | Improvement |
|---|---|---|---|---|
| 2024 | $483 | $15,157 | $1,280 | $13,877 |
| 2023 | $356 | $11,118 | $1,280 | $9,838 |
| 2022 | $75 | $11,118 | $1,280 | $9,838 |
| 2021 | $94 | $13,074 | $3,200 | $9,874 |
| 2020 | $72 | $13,074 | $3,200 | $9,874 |
| 2019 | $52 | $13,074 | $3,200 | $9,874 |
| 2018 | $77 | $10,782 | $3,200 | $7,582 |
| 2017 | $77 | $10,782 | $3,200 | $7,582 |
| 2016 | $78 | $10,782 | $3,200 | $7,582 |
| 2015 | $78 | $10,782 | $3,200 | $7,582 |
| 2014 | $63 | $9,882 | $3,000 | $6,882 |
Source: Public Records
Map
Nearby Homes
- 611 W Moore St
- 904 W Moore St
- 702 Bellevue Ave
- 912 Druid St
- 906 Central Ave
- 0 Woodlawn Dr
- 712 Stonewall St
- 109 Hillcrest Dr
- 703 Euclid St
- 209 Mimosa Dr
- 604 N Washington St
- 904 Euclid St
- 214 Mimosa Dr
- 305 Mary St
- 00 Woodrow Ave
- 305 Wolfe St
- 0 E Columbia St Unit 10600868
- 108 N Washington St
- 0 Georgia 257
- 401 Pine St